Chapter 2 Working with DaqLab 51
a. Click Setup Wizard on the main toolbar to open the Setup wizard.
b. Click Properties
next to the input you want to set.
c. Click the Display properties tab.
d. Select a measurement from the Select measurement drop-down menu.
e. Select the graph or graphs in which you would like to display the data, from the
Display on graph drop-down menu.
f. Select a meter in the Meter type drop list if you want to display the data in a meter
as well as on the graph.
g. Format the line and markers in the Plot section.
h. If you want a specific scale, uncheck the Auto scale check box and enter the
desired minimum and maximum values of the axis.
i. Click OK.
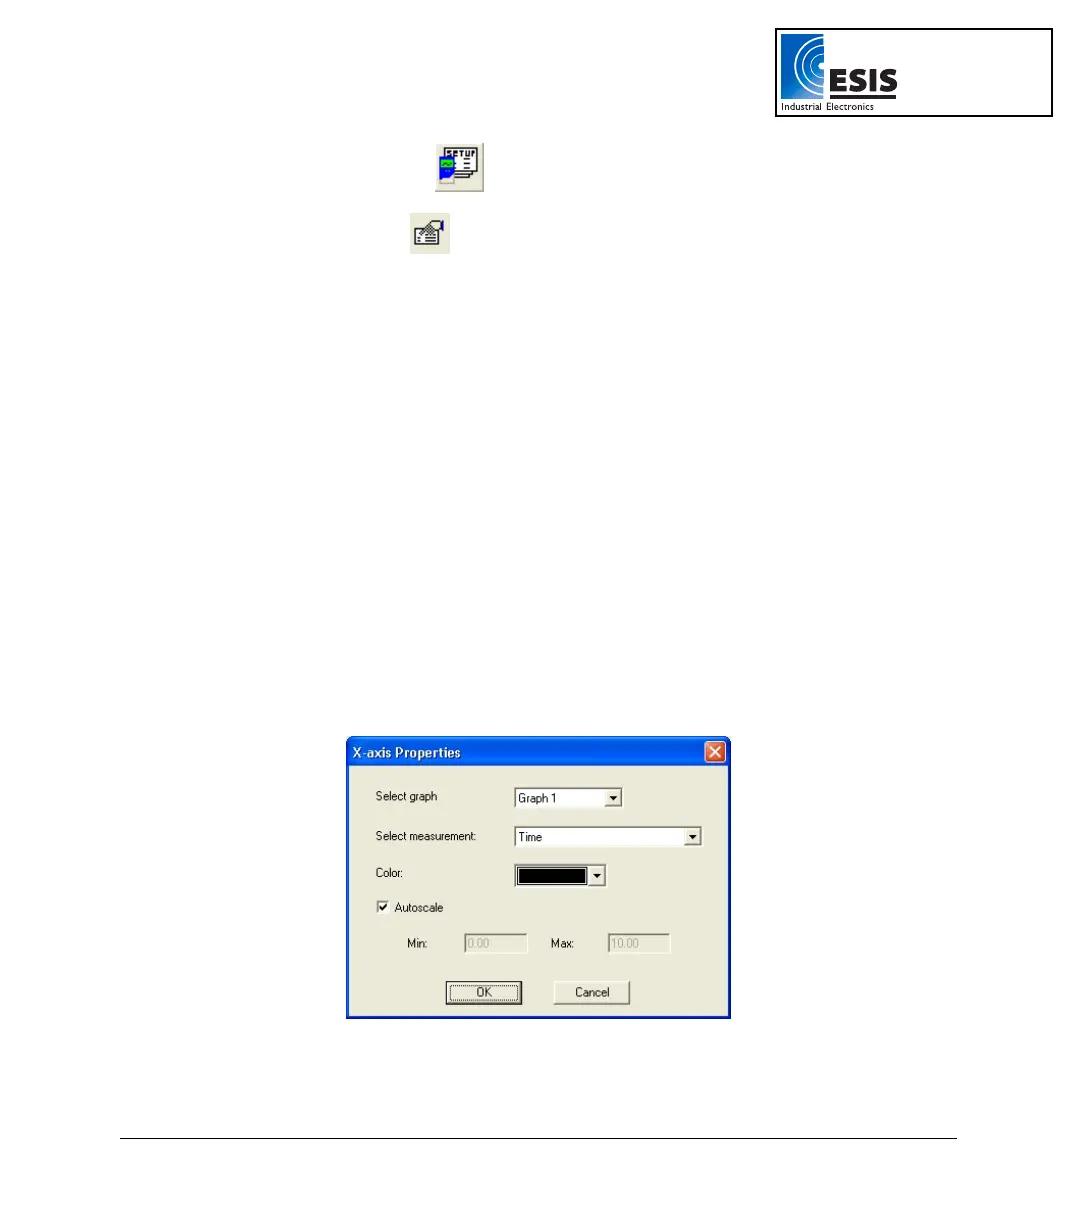
7. Preset the Graph’s X-axis
a. Click X-Axis display properties in the first step of the Setup wizard to open the
dialog:
Figure 14: X-axis properties dialog box
www.esis.com.au
Ph 02 9481 7420
Fax 02 9481 7267
esis.enq@esis.com.au