40 Chapter 2 Working with DaqLab
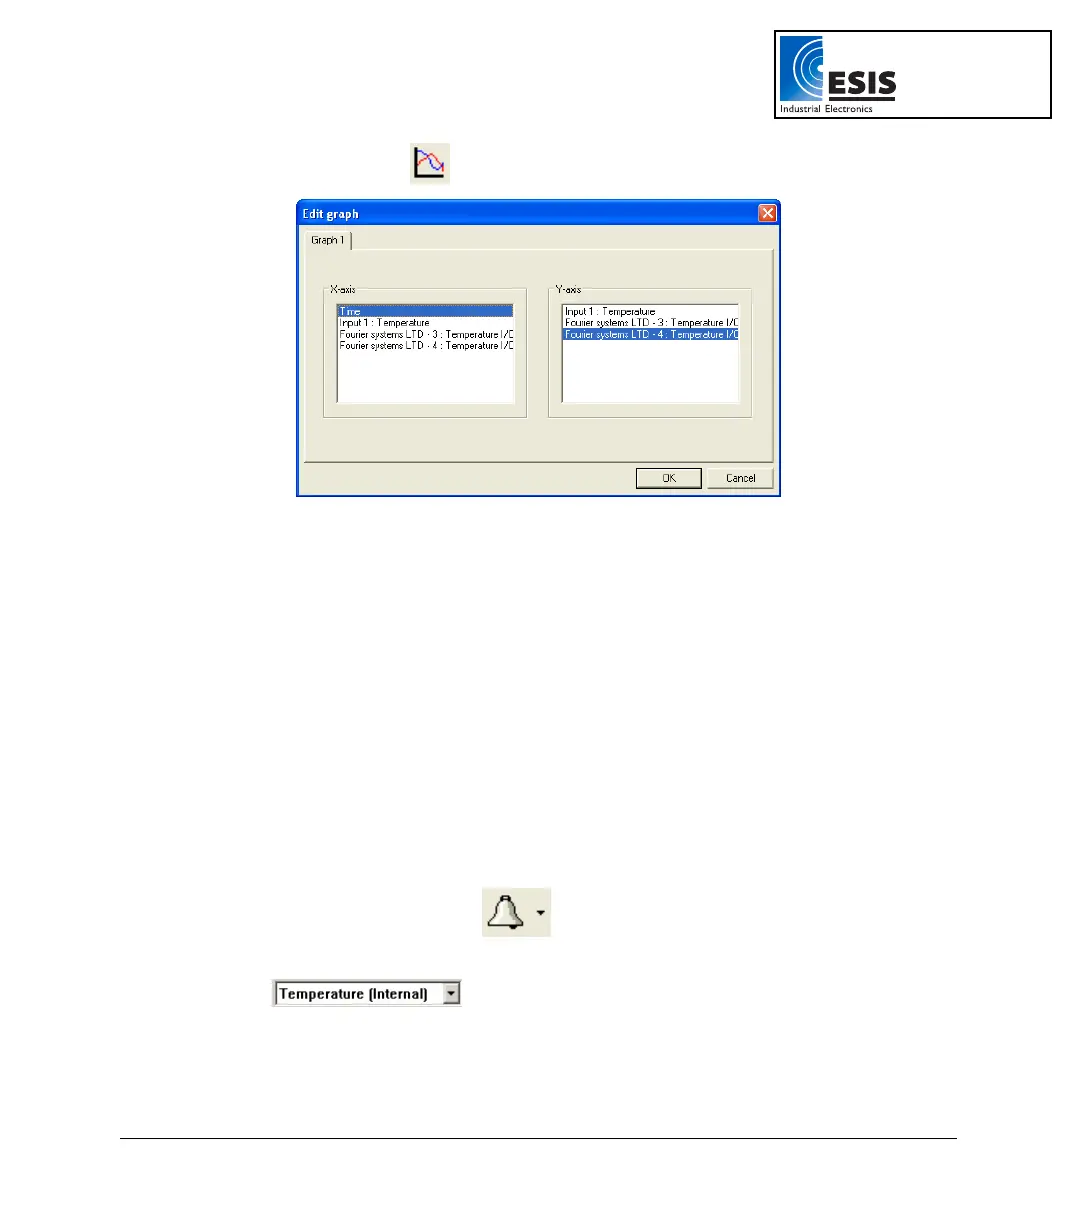
b. Click Edit graph on the graph toolbar to open the Edit graph dialog box:
Figure 9: Edit graph dialog box
c. To select a data set to display on the Y-axis, click on the data set’s name in the
Y-axis list. To display more than one curve, click on the data sets you want.
A list entry that begins with a DaqPRO comment denotes a recorded data set. A
list entry that begins with an input number denotes the next recording and will be
displayed on the graph the next time you start a recording.
d. To deselect a data set, click on it a second time.
e. To select a data set for display on the X-axis, click on the data set’s name in the
X-axis list. You can only select one data set at a time for the X-axis.
f. Click OK.
6. Display Alarm Levels
a. Click Display alarm level
.
b. Select the sensor you wish to display from the select sensor drop list
.
c. To display alarm levels on graph 2 in split graph mode, click the down arrow next
to the button and select graph 2.
www.esis.com.au
Ph 02 9481 7420
Fax 02 9481 7267
esis.enq@esis.com.au