EasyManuals Logo

Furuno FEA-2107 User Manual

Furuno FEA-2107
664 pages
To Next Page IconTo Next Page
To Previous Page IconTo Previous Page
Page #408 background imageLoading...
Page #408 background image
23. Recording Functions
23-12
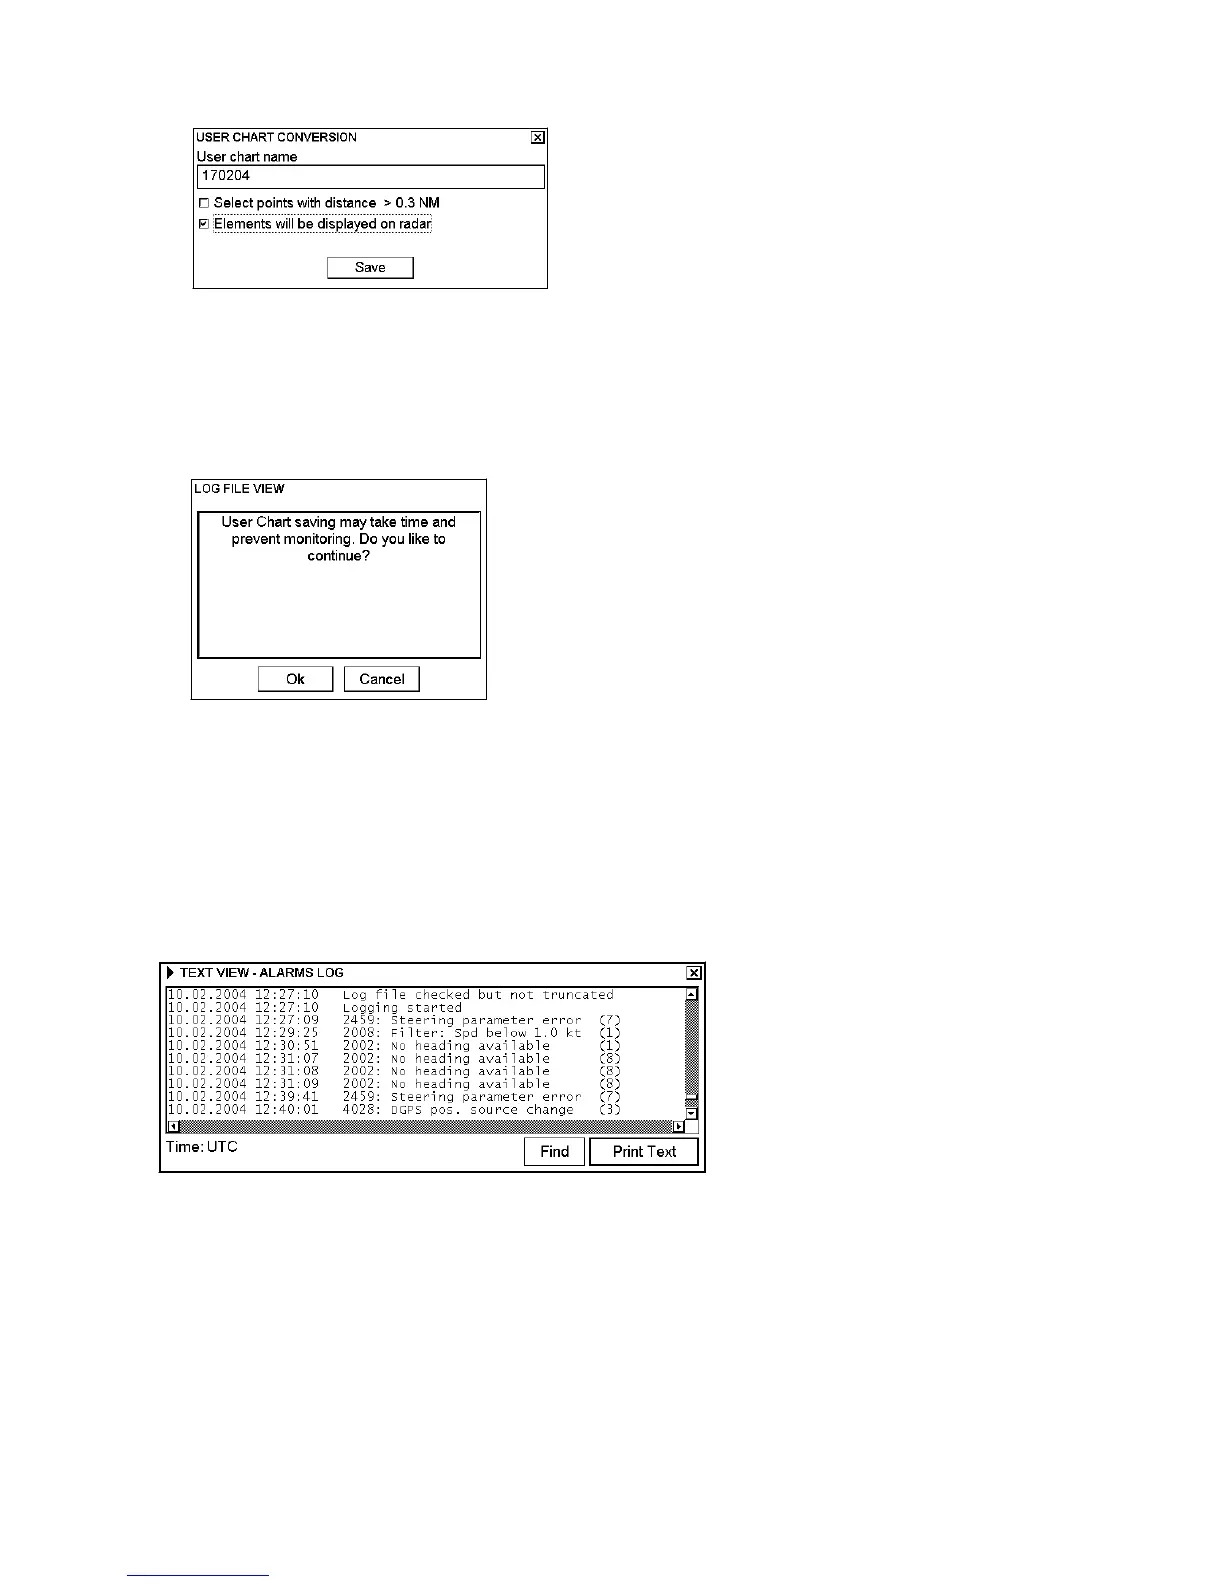
6. The User Chart Conversion dialog box appears.
This dialog box contains the following fields:
User chart name: Enter name for the user chart.
Select points with distance > 0.3 NM: Check to have the system filter the chosen log so that the minimum
distance between points in the user chart is 0.3 nm.
Elements will be displayed on radar: Check to display the chart on the radar screen.
7. Click the Save button.
8. Confirm creating of user chart by clicking the OK button.
Note: If your chosen range for conversion from log to user chart contains periods of invalid own ship positions, then
the user chart has a gap in the line for these periods.
23.3.9 Alarms log
The alarm log collects and records alarms generated by the system. You may view a list of generated alarms using
the Alarms Log.

Table of Contents

Questions and Answers:

Question and Answer IconNeed help?

Do you have a question about the Furuno FEA-2107 and is the answer not in the manual?

Furuno FEA-2107 Specifications

General IconGeneral
Display Size10.4 inches
Resolution800 x 600 pixels
Contrast Ratio500:1
Operating Temperature-15°C to +55°C
Aspect Ratio4:3
Response Time25 ms
Storage Temperature-20°C to +70°C
Vibration Resistance1.0 g
Input Voltage12-24 VDC
Input SignalVGA
MountingBracket mount (optional)
Humidity93% RH
Shock Resistance10 G

Related product manuals