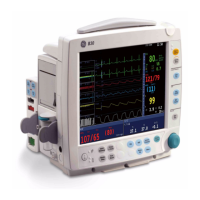
B30 Patient Monitor
17-2
Display of gases
Figure 17-3 Airway gas waveform display
(1) 30 minute trend for CO
2
(selected in the Monitor Setup menu)
(2) Gas waveforms
(3) Message field for gases
(4) Gas label
(5) Digit field for ET and FI gas values
(6) Respiration rate
(7) Scale
NOTE: When the measured CO
2
value is outside the specified measurement range, the
numeric value is gray.
Figure 17-4 Lower digit field for gases
 Loading...