7.3 Displaying detailed trends
104
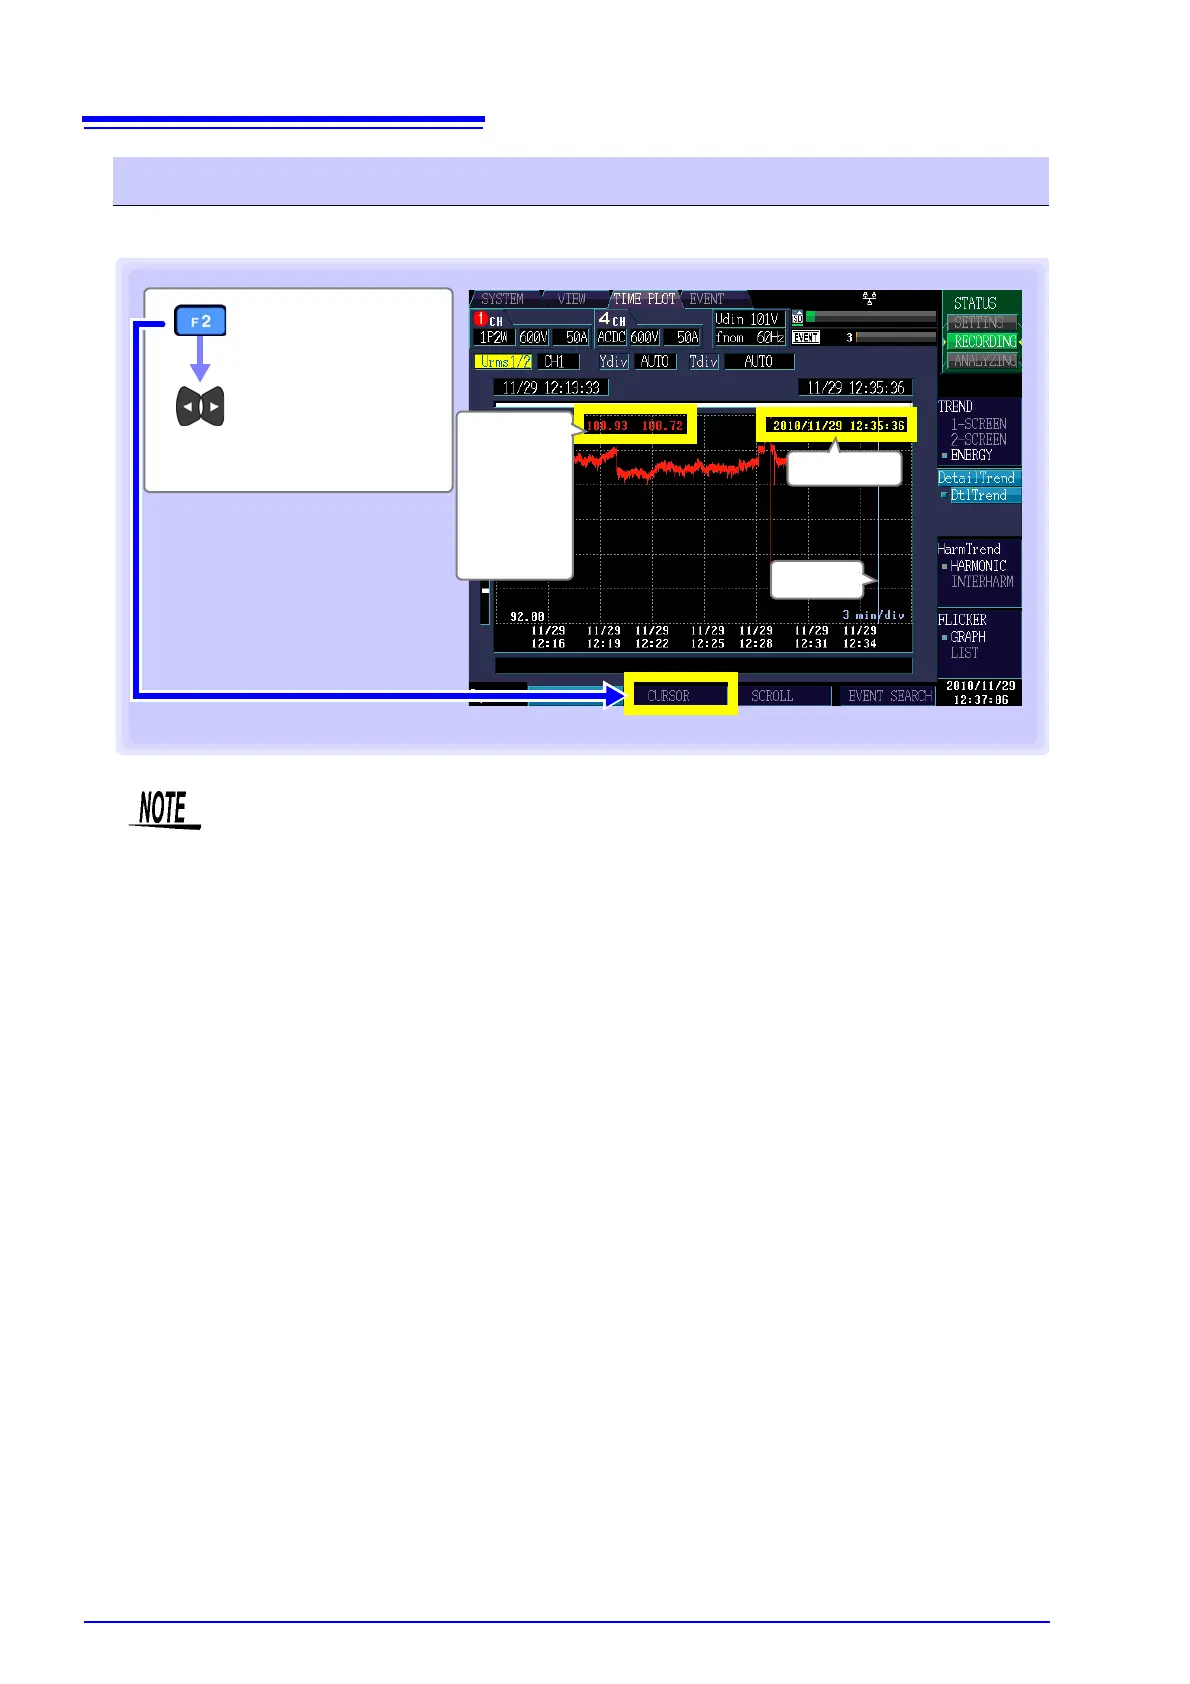
You can read the value above the cursor and the time on the time series graph.
Reading the value above the cursor (Cursor measurements)
[CURSOR]
Move the vertical
cursor left and
right to read the
display value.
Cursor color
Red: CH1
Yellow: CH2
Blue: CH3
Cursor
Cursor time
Cursor value
Left:
Maximum
value
Right:
Minimum
value
• When the TIMEPLOT interval is set to 150 or 180 cycles, the time is shown in ms
units.
• The time displayed during cursor measurement is based on the CH1 voltage (U1).
The event time shown on the event list and the time displayed during cursor mea-
surement may not agree.