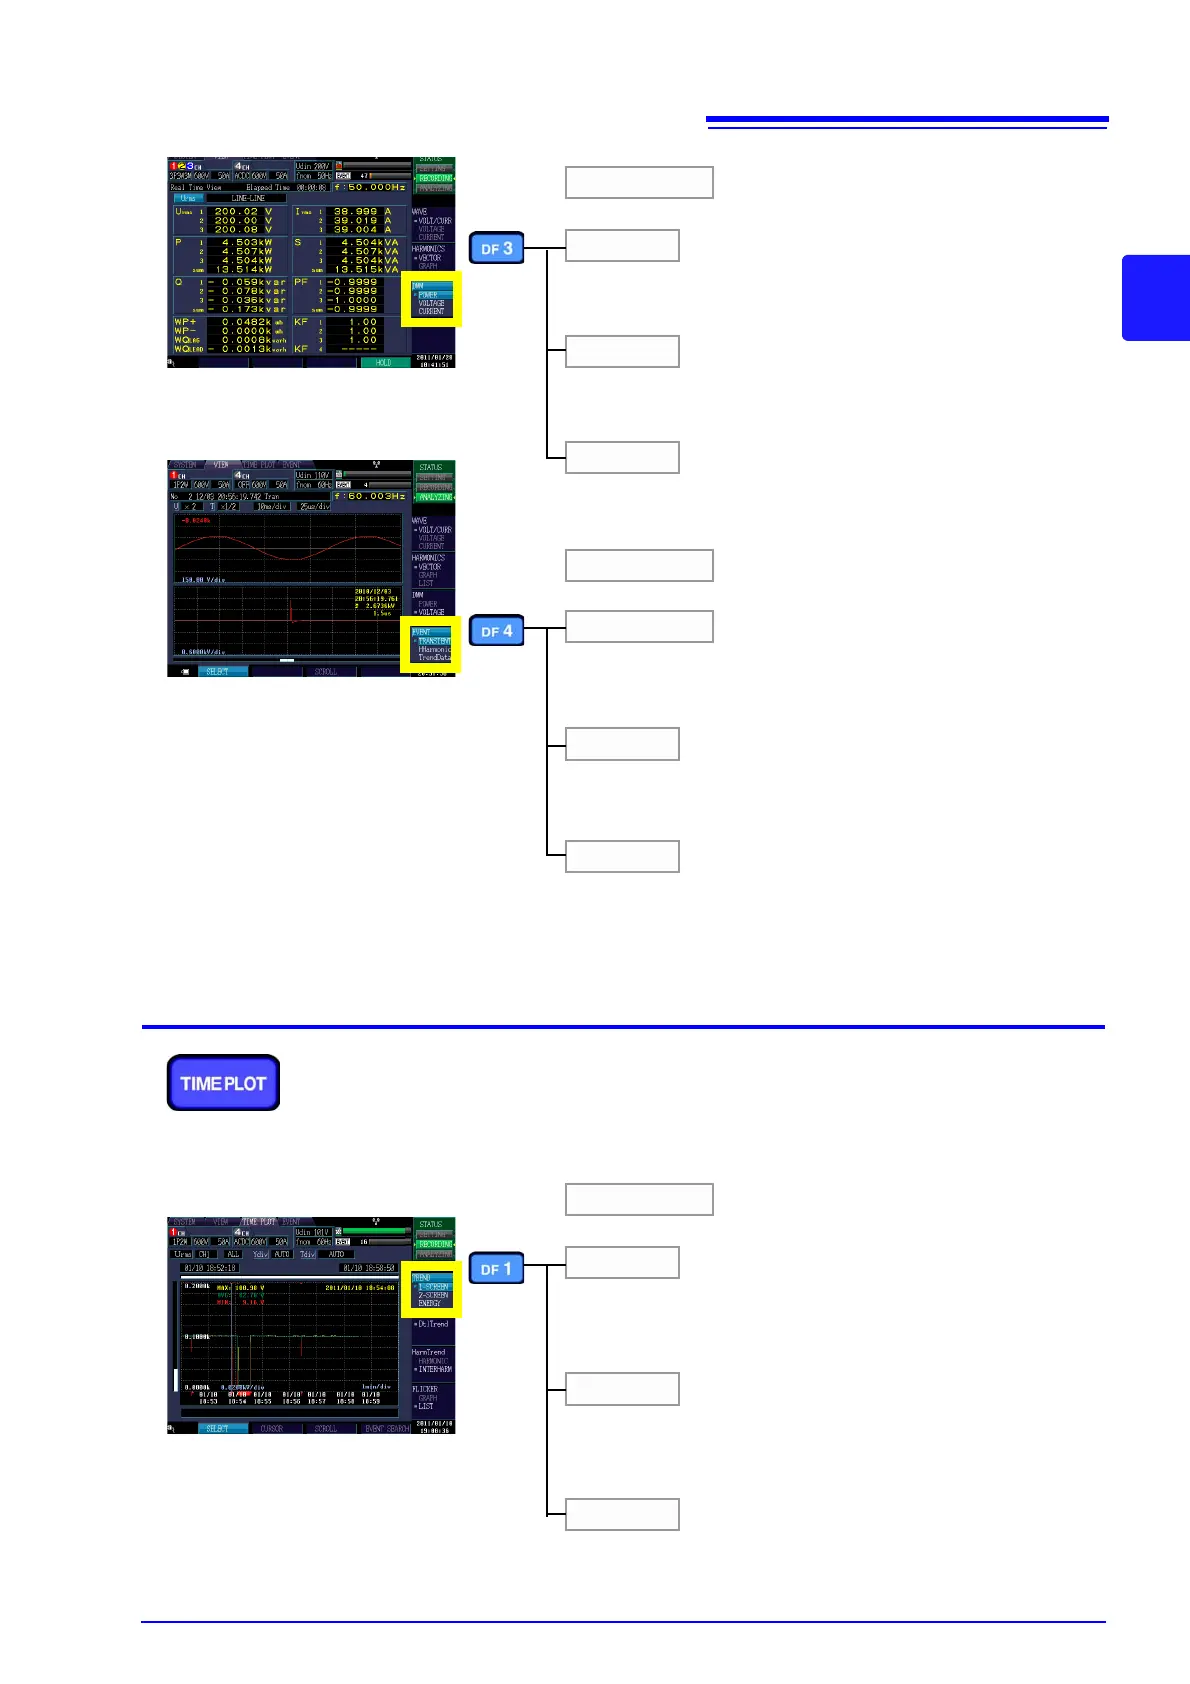
POWER
VOLTAGE
CURRENT
DMM
Displays the RMS voltage, RMS current, active power, apparent
power, reactive power, power factor, integral power, and K factor
instantaneous values.
Displays the RMS voltage, voltage distortion factor, ± current
peak value, current unbalance factor, harmonic voltage compo-
nent, and 10-sec frequency instantaneous values.
See: 6.5 (p.89)
Displays the RMS current, current distortion factor, ± current
peak value, current unbalance factor, and high-order harmonic
current component instantaneous values.
TRANSIENT
HHarmonic
TrendData
EVENT
Displays the transient waveform obtained by high-speed sam-
pling when an event occurred.
See: 8.4 (p.126)
Displays the high-order harmonic voltage and current waveforms
at the time of event occurrence.
See: 8.5 (p.129)
Displays a 30-second time series graph depicting fluctuations in
the swell, dip, interruption, or inrush current when an event oc-
curred (0.5 s before and 29.5 s after EVENT IN) (for 400 Hz mea-
surement, approx. 0.125 s before and approx. 7.375 s after
EVENT IN).
See: 8.6 (p.132)
Shown only in [ANALYZING] mode.
1-SCREEN
2-SCREEN
TREND
Displays the RMS value measured using data collected over ap-
proximately 200 ms, the average value of peak or other values
during the TIMEPLOT interval, or the maximum, minimum, and
average values as a time series, showing one per screen.
Displays the RMS value measured using data collected over ap-
proximately 200 ms, the average value of peak or other values
during the TIMEPLOT interval, or the maximum, minimum, and
average values as a time series, showing two per screen.
See: 7.2 (p.94)
Monitor changes in
measured values
(TIME PLOT screen)
The [TIMEPLOT] screen is used to view RMS, voltage,
and harmonic fluctuations as time series graphs. Flicker
values can also be shown as a graph or list.
Press the TIMEPLOT key to display the [TIMEPLOT]
screen. The screen can be changed with the DF keys.
ENERGY
Displays the active energy (WP+/WP-) or reactive energy
(WQLAG/WQLEAD) as selected.
 Loading...


