143
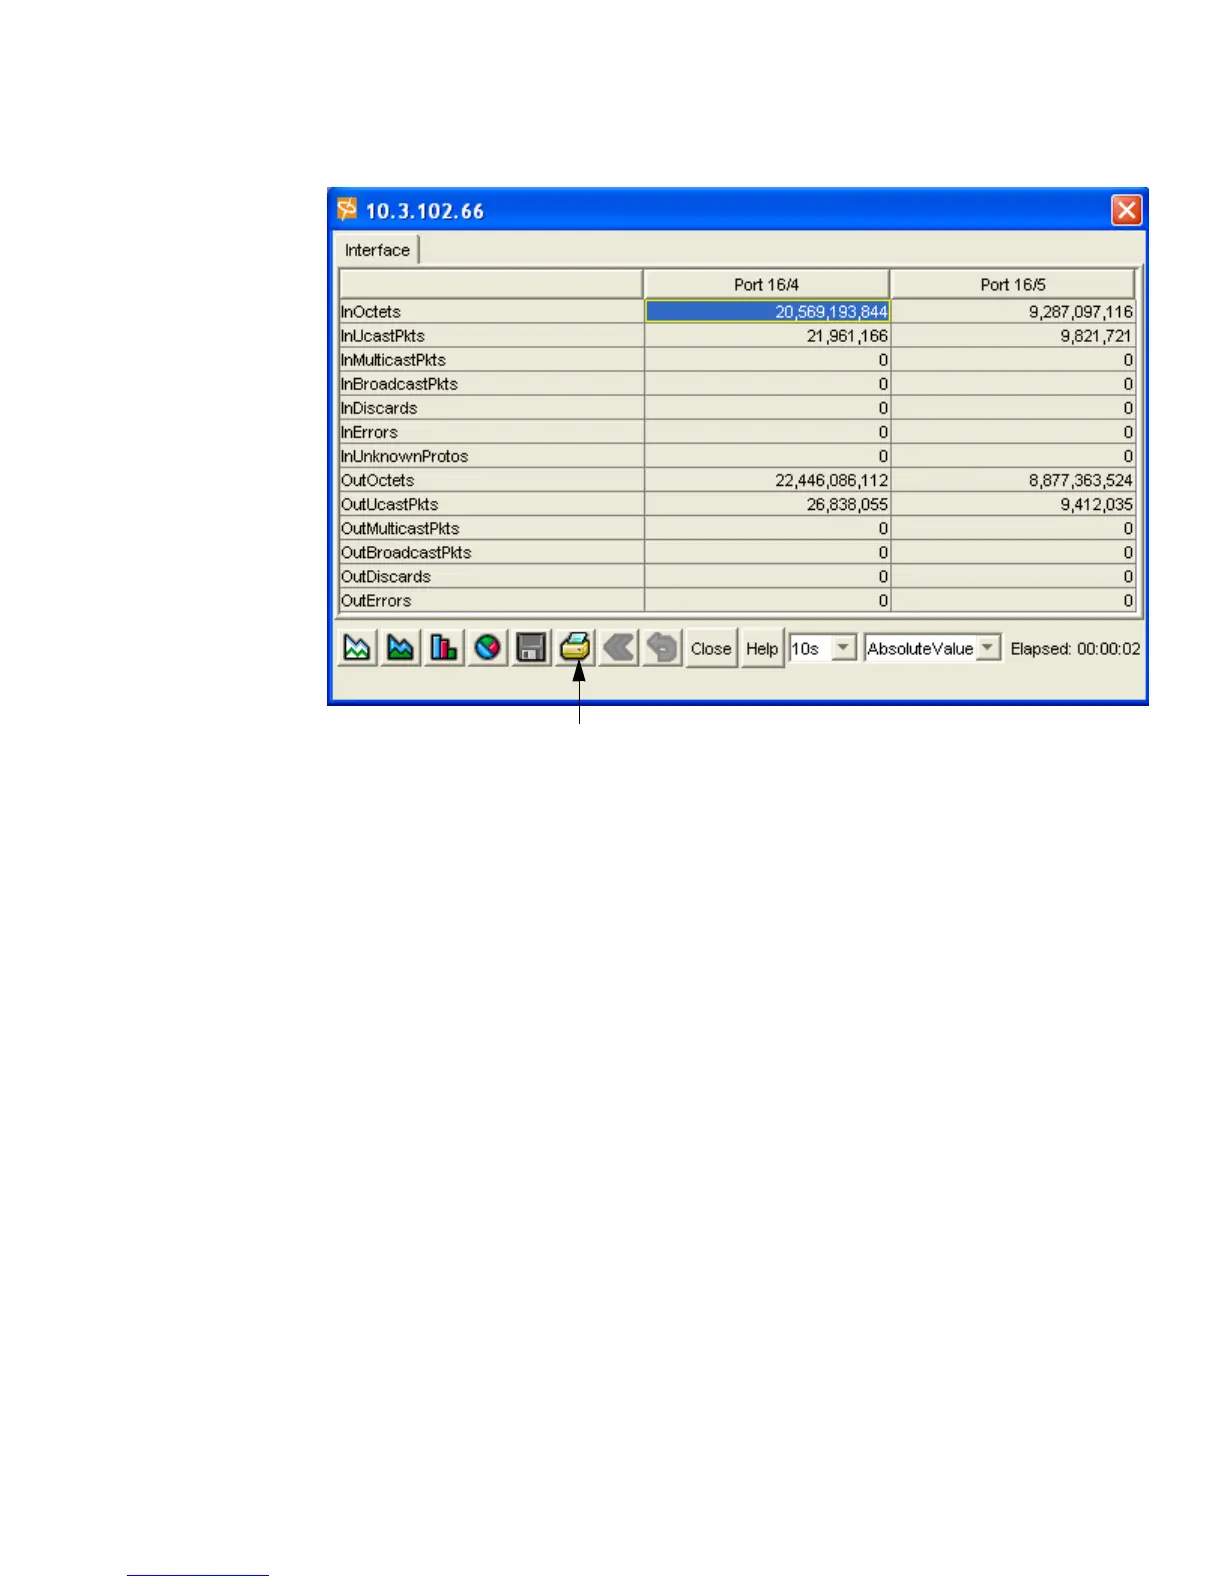
2. Click the print icon from the data table.
Creating a Data Analysis Graph
Statistical data is displayed in a table by default. However, you can use the data in the tabular format to
create a variety of graphs.
1. Create a table of network data.
Refer to “Creating a Data Analysis Table” on page 140
 Loading...