Legacy Fan Speed Control
Thermal and Mechanical Design Guidelines 101
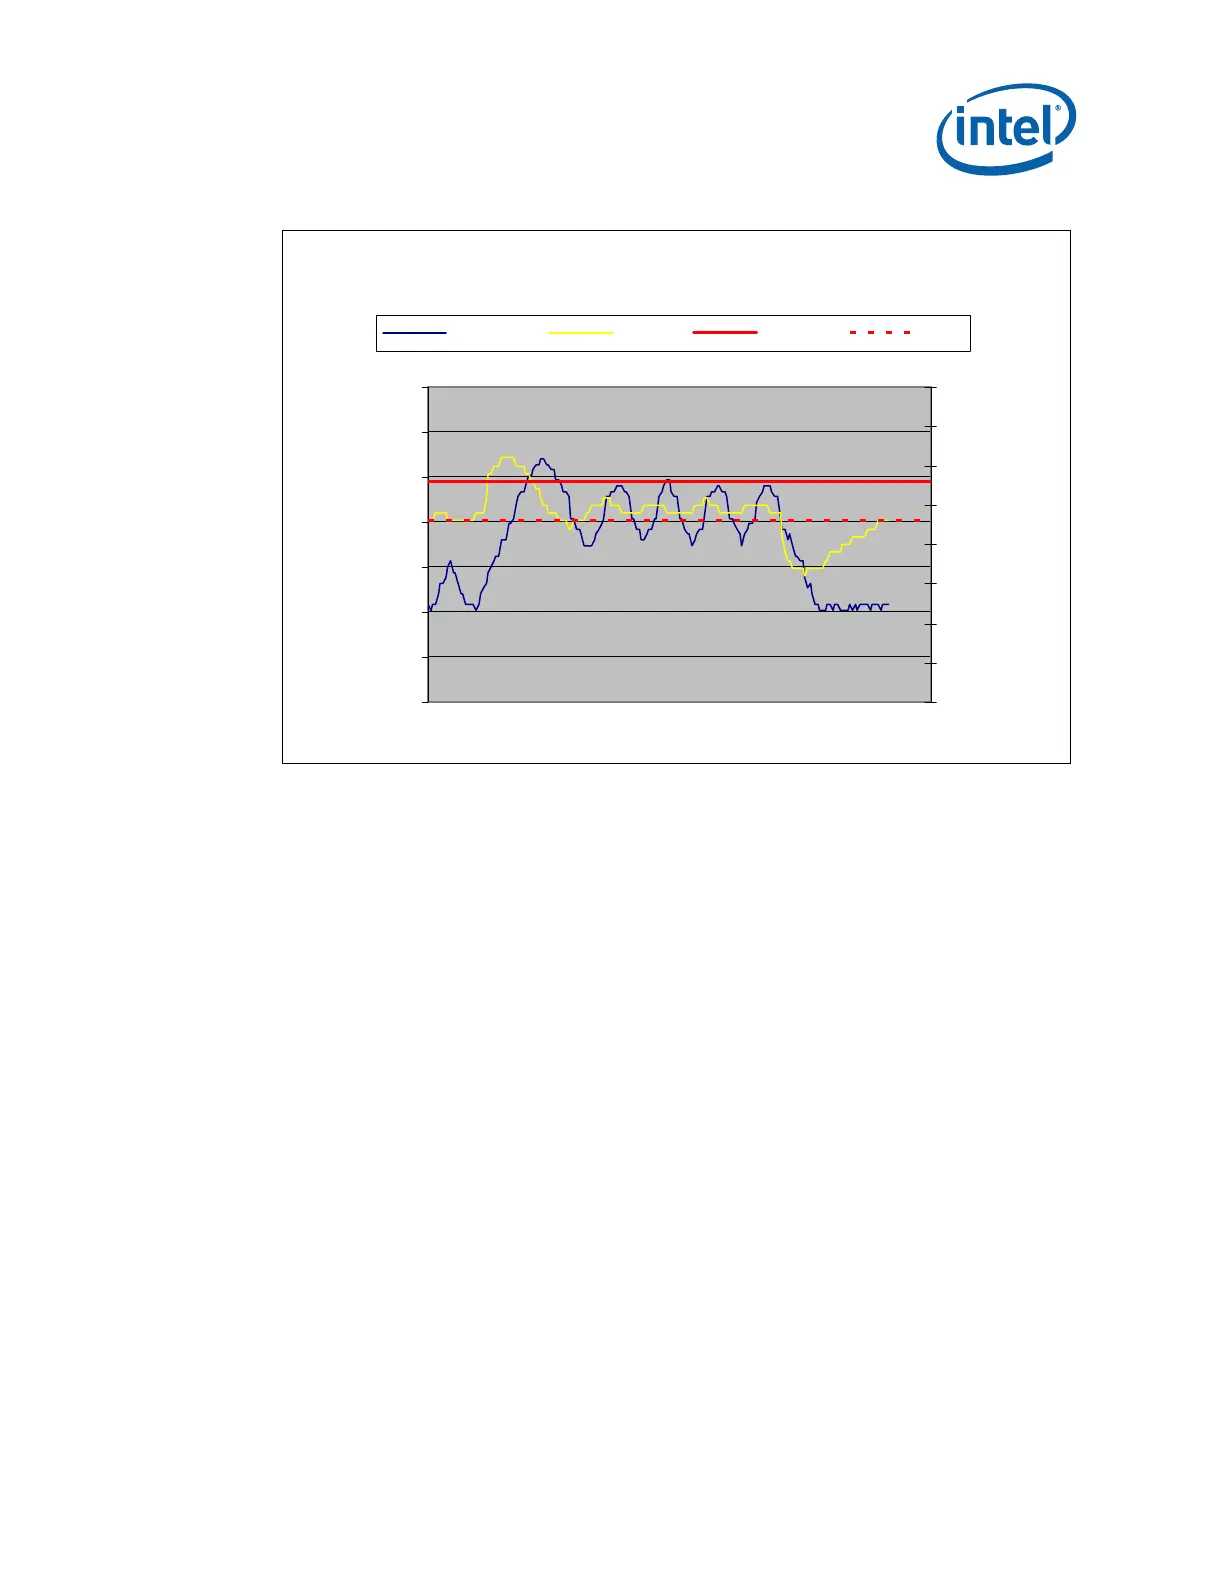
Figure 60. Temperature Range = 5 °C
0
500
1000
1500
2000
2500
3000
3500
Time (s)
RPM
40
45
50
55
60
65
70
75
80
Tdiode (C)
Fan RPM Tdiode Tcontrol Tlow
An alternate would be to consider a slightly larger value such as
T
RANGE
= 10 °C. In
this case the design is trading off the acoustic margin for thermal margin.
•
There is increased granularity in the fan speeds.
• Fan speed oscillation are significantly reduced
• Maximum fan speed is lower
The rate of change of Ψ
CA
vs. RPM is an exponential curve with a larger decrease at
the beginning of the fan acceleration than as the maximum speed is approached. By
having the fan start to accelerate at a lower T
SENSOR
reading the thermal solution can
keep up with rate of change in processor power. The rate of change in acoustics
(dBA) is more linear with RPM. When comparing these two metrics the choice of a
larger T
RANGE
value becomes a more acceptable trade off. Figure 61 graphs the system
at the same conditions as in
Figure 60 but T
RANGE
= 10°.