Intel Thermal/Mechanical Reference Design Information
Thermal and Mechanical Design Guidelines 49
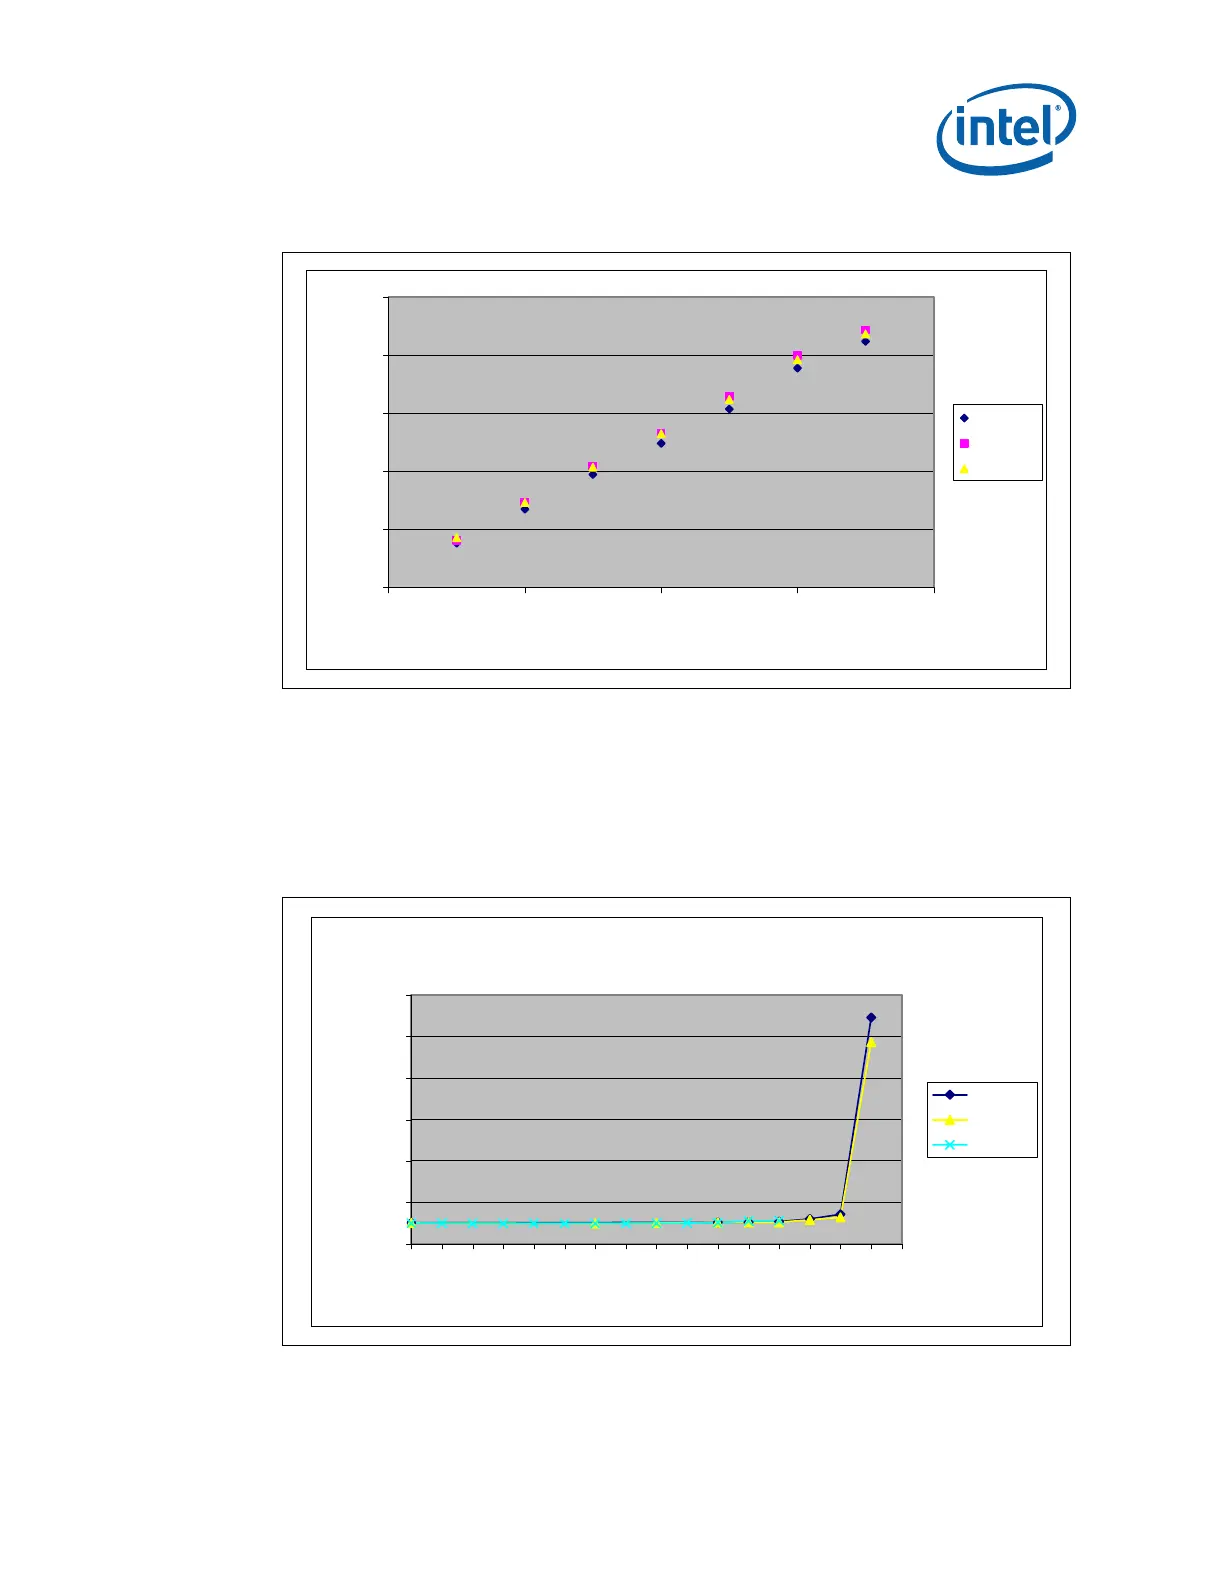
Figure 13. The Assembly Cumulative Mass Loss Data in Continuous Operation Test at
50 ºC and 1450 RPM
0.0
0.5
1.0
1.5
2.0
2.5
02468
Week
Cumulative mass loss (grams)
Pump-1
Pump-2
Pump-3
The reservoir presence in assembly and its impact on thermal performance was also
confirmed by drawing the liquid out in the increment of 5 mL and measuring thermal
performance at each increment. The Thermal resistance data are shown in
Figure 14.
It can be seen that when the liquid of 65 mL or more is drawn, thermal resistance
goes up significantly. The test verifies the role of reservoir in maintaining thermal
performance with liquid loss up to the reservoir size of 38 mL and 27 mL beyond that.
Figure 14. Thermal Resistance Curve for Liquid Loss of Reservoir
Theta ca vs. fluid level
0.000
0.200
0.400
0.600
0.800
1.000
1.200
0 5 10 15 20 25 30 35 40 45 50 55 60 65 70 75 80
Fluid Removed [ml]
Theta ca [C/W]
Pump-1
Pump 3
Pump 2