5.5 Acquire measurement data
5.5.1 Visualization
Move to the Signals tab.
Select Display from the main menu.
IPEmotion displays measurement values of all active channels continuously in the channel grid.
Change to the View tab to create and arrange alphanumerical and graphical display components
(numeric display, tachometer, bargraph, y-t-diagram, ...) or use the oscilloscope feature to display periodic
signals at higher frequencies.
Click Stop from the main menu to stop data visualization.
5.5.2 Storage
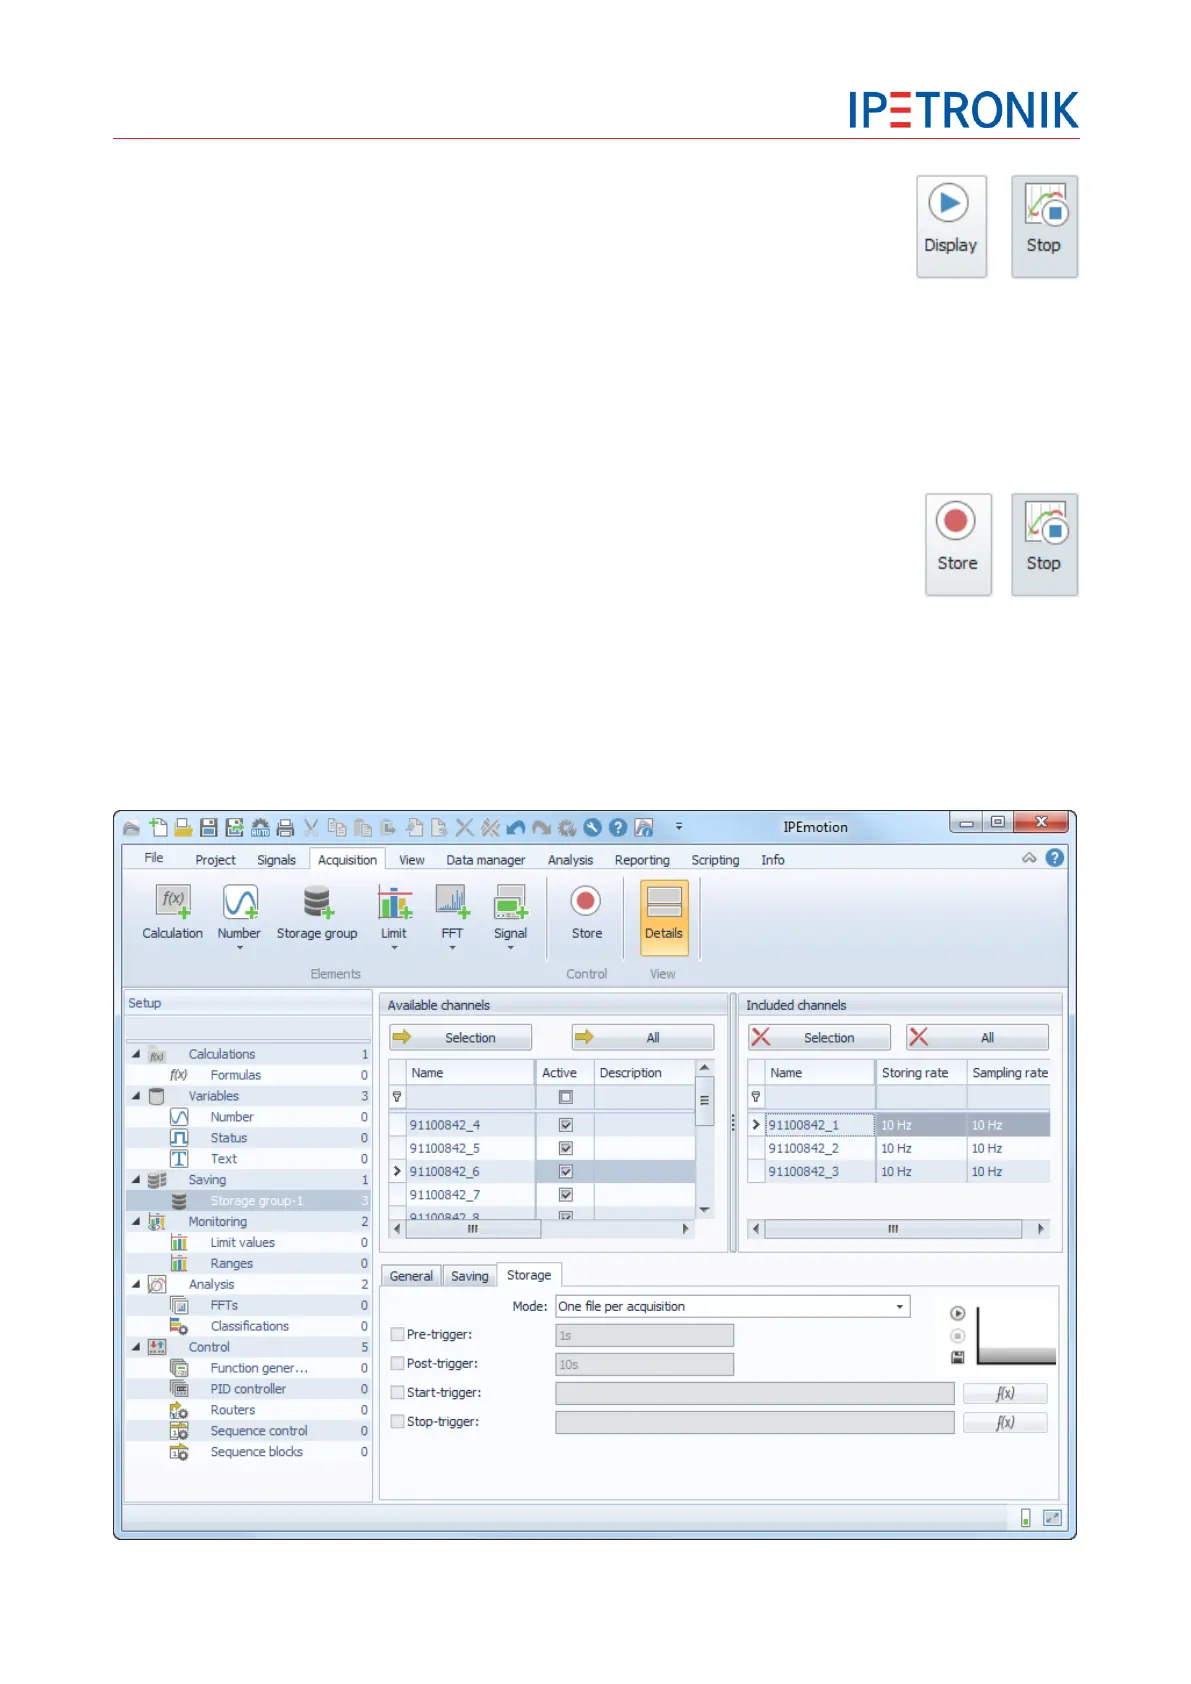
Move to the Acquisition tab.
Right click to Saving from the left-hand Setup structure,
select Storage group from the context menu.
Create one or more storage groups for your measurement task.
Assign active channels (measurement signals) to your storage groups which you created previously.
If required, change the storing rate to lower data rates or use the average function (MEAN).
Define individual trigger events as required to control data storage.
Click Store from the main menu to start data storage.
Click Stop from the main menu to stop data storage.