LACO ORIGINAL OPERATING INSTRUCTIONS TITANTEST™
25
© 2018 LACO TECHNOLOGIES, INC. - [TitanTest itna01en1-07 BA.fm] - 1807
Menu name c
Select the menus by pressing the adjacent round buttons located to the left
or right of the display. For more information on the meaning of the symbols,
see Chapter 6.2.3: "Recurring function symbols", page 24.
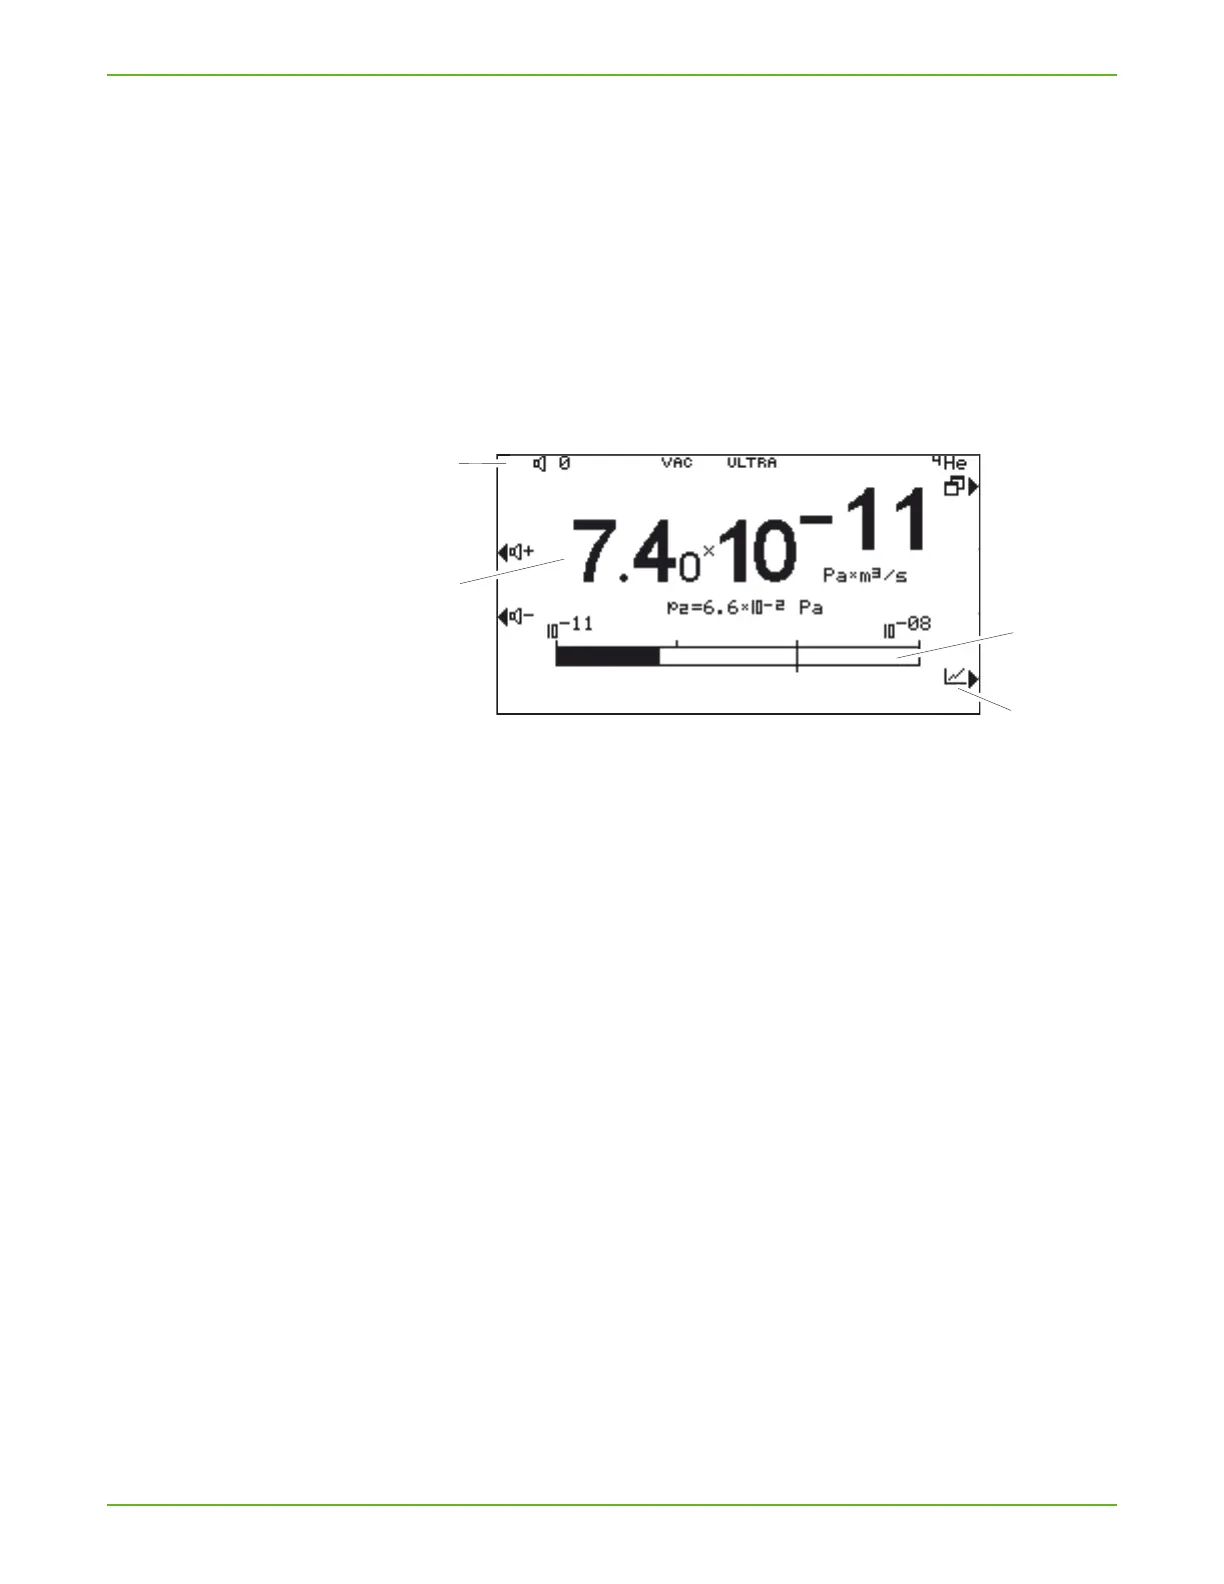
6.2.5 Measurement display
The measured leakage rates are shown numerically with a bar graph or
graphically in a diagram as a function of the measuring time.
You can switch between display options using the button located on the
lower right. Next to this button is the symbol for the analog display or the
graphic display.
Fig. 8: Numerical measurement display
a Information area
b Current measured value
c Bar graph, logarithmic
d Switch to graphic measurement display
Information area a
Shows the current state of the device:
volume, operating mode, measuring situation, ZERO active, tracer gas
Current measured value
b
The current measured value is displayed. Under this the pressure at test port
p2 is shown.
Bar graph, logarithmic
c
The current measured value is shown in a bar graph.