LACO ORIGINAL OPERATING INSTRUCTIONS TITANTEST™
26
© 2018 LACO TECHNOLOGIES, INC. - [TitanTest itna01en1-07 BA.fm] - 1807
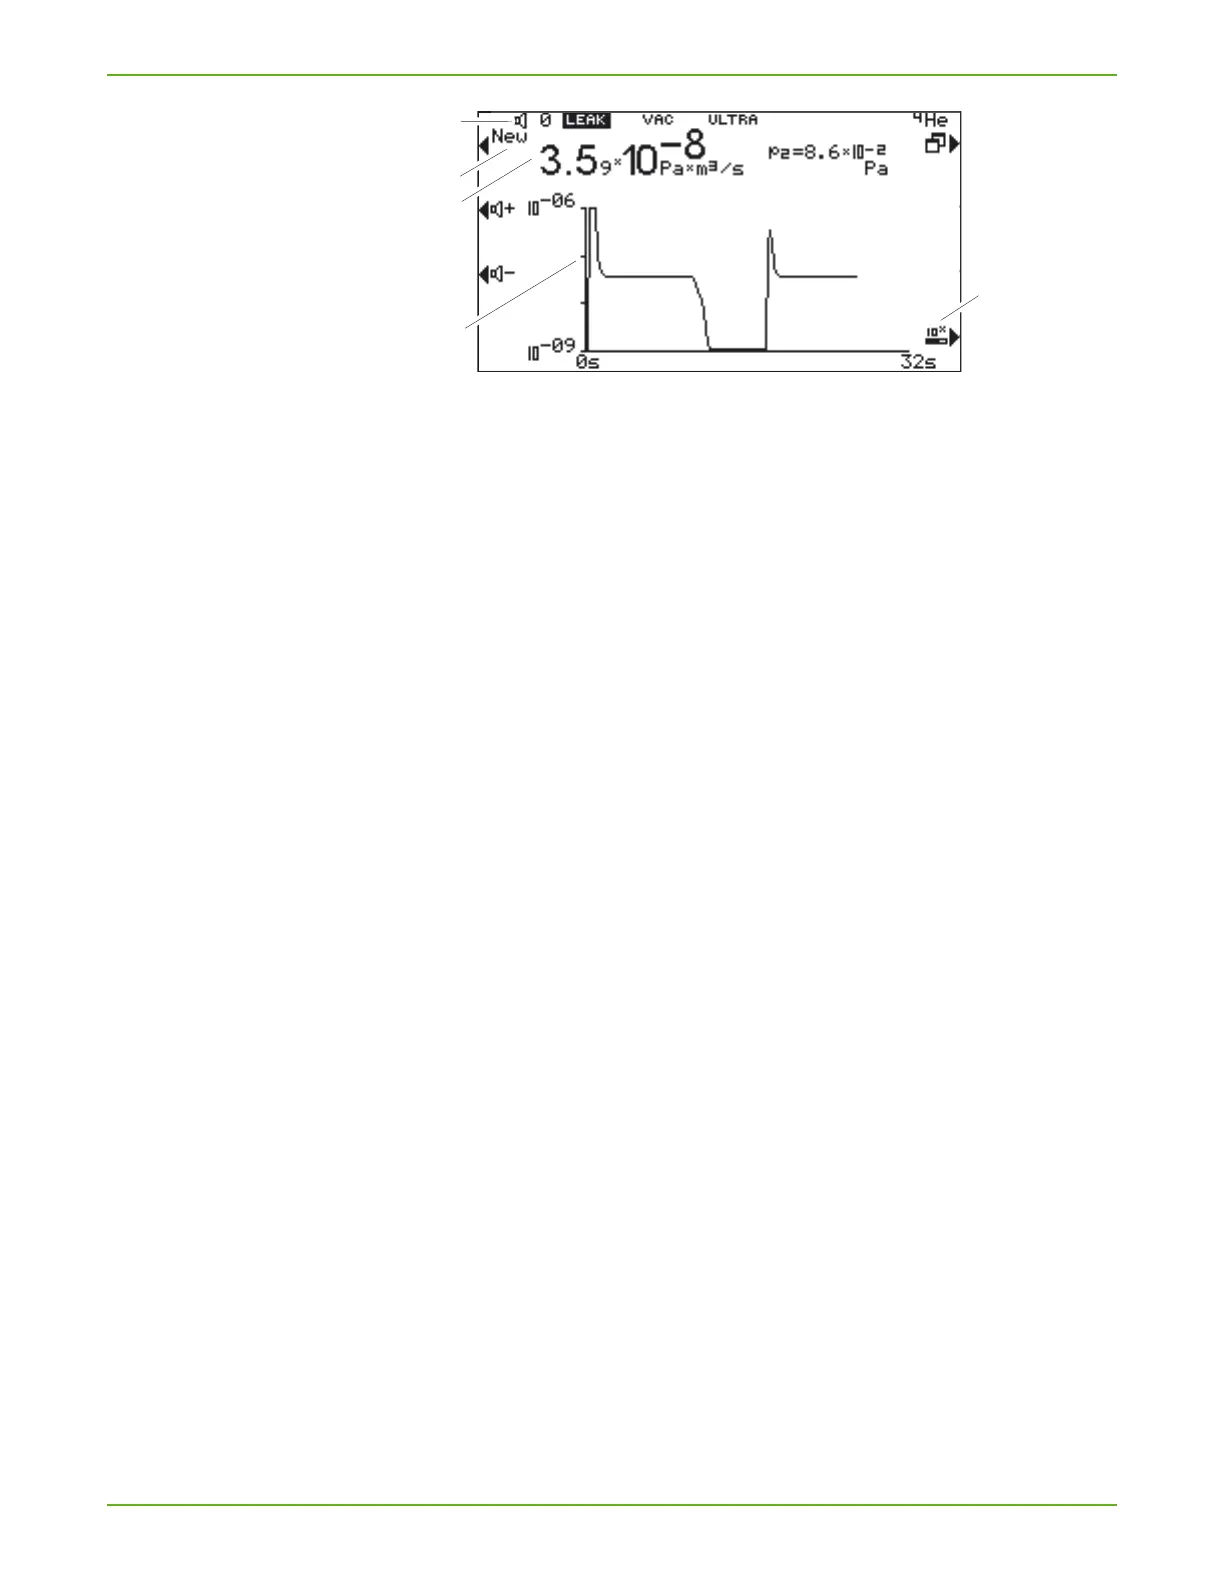
Fig. 9: Graphic measurement display
Information area a
Shows the current state of the device:
volume, operating mode, measuring situation, ZERO active, tracer gas
The graph is started again by pressing Graph
b.
Current measured value
c
The current measured value is displayed as a logarithm.
Measured value displays as function
d
Shows the progress of the measured values as a function of time.
a Information area
b Graph
c Current measured value
d Measured value displays as function
e Switch to analog measurement display