Measuring process
48 Power Analyzer NORMA 4000, NORMA 5000
EO1111G REV G
Display Description
φ1 ... φ3
Phase angle between U and I
φU1
... reference point (always = 0)
φU2
Angle between U2 and U1
φU3
Angle between U3 and U1
scale
Range (reference value for the diameter of the outer
circle)
To view a different channel or different measured values in
vector graph form, press measuring keys
∑
or 1...n and WAV.
The scale of the vector in the vector diagram can de zoomed.
To automatically optimise the scale of the graph, press
function key Default.
The scale is set to the measurement range.
To change the scale of the axes, press function key Scale U or
Scale I.
Adjust the scale, using the cursor keys up / down press Enter
to confirm or Esc to exit. I.
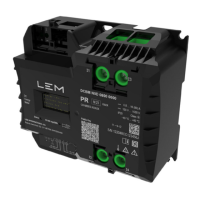
8.3.3 Oscilloscope curves
The digital oscilloscope function (DSO) allows for display of signals
in curves, so that signal distortions can be quickly detected.
Press measuring keys
∑
or 1...n and WAV to call up the
desired values, e.g. values measured at channels 1.
Press measuring key Oscilloscope curves.
The measured values are shown in the form of oscilloscope
curves.
To view the details regarding a measured value, press function
key Detail.
The display shows the measured voltage.
Adjust scale
iew
oscilloscope
display