Catch Sensors | V1 | Servicing and Maintenance
3.
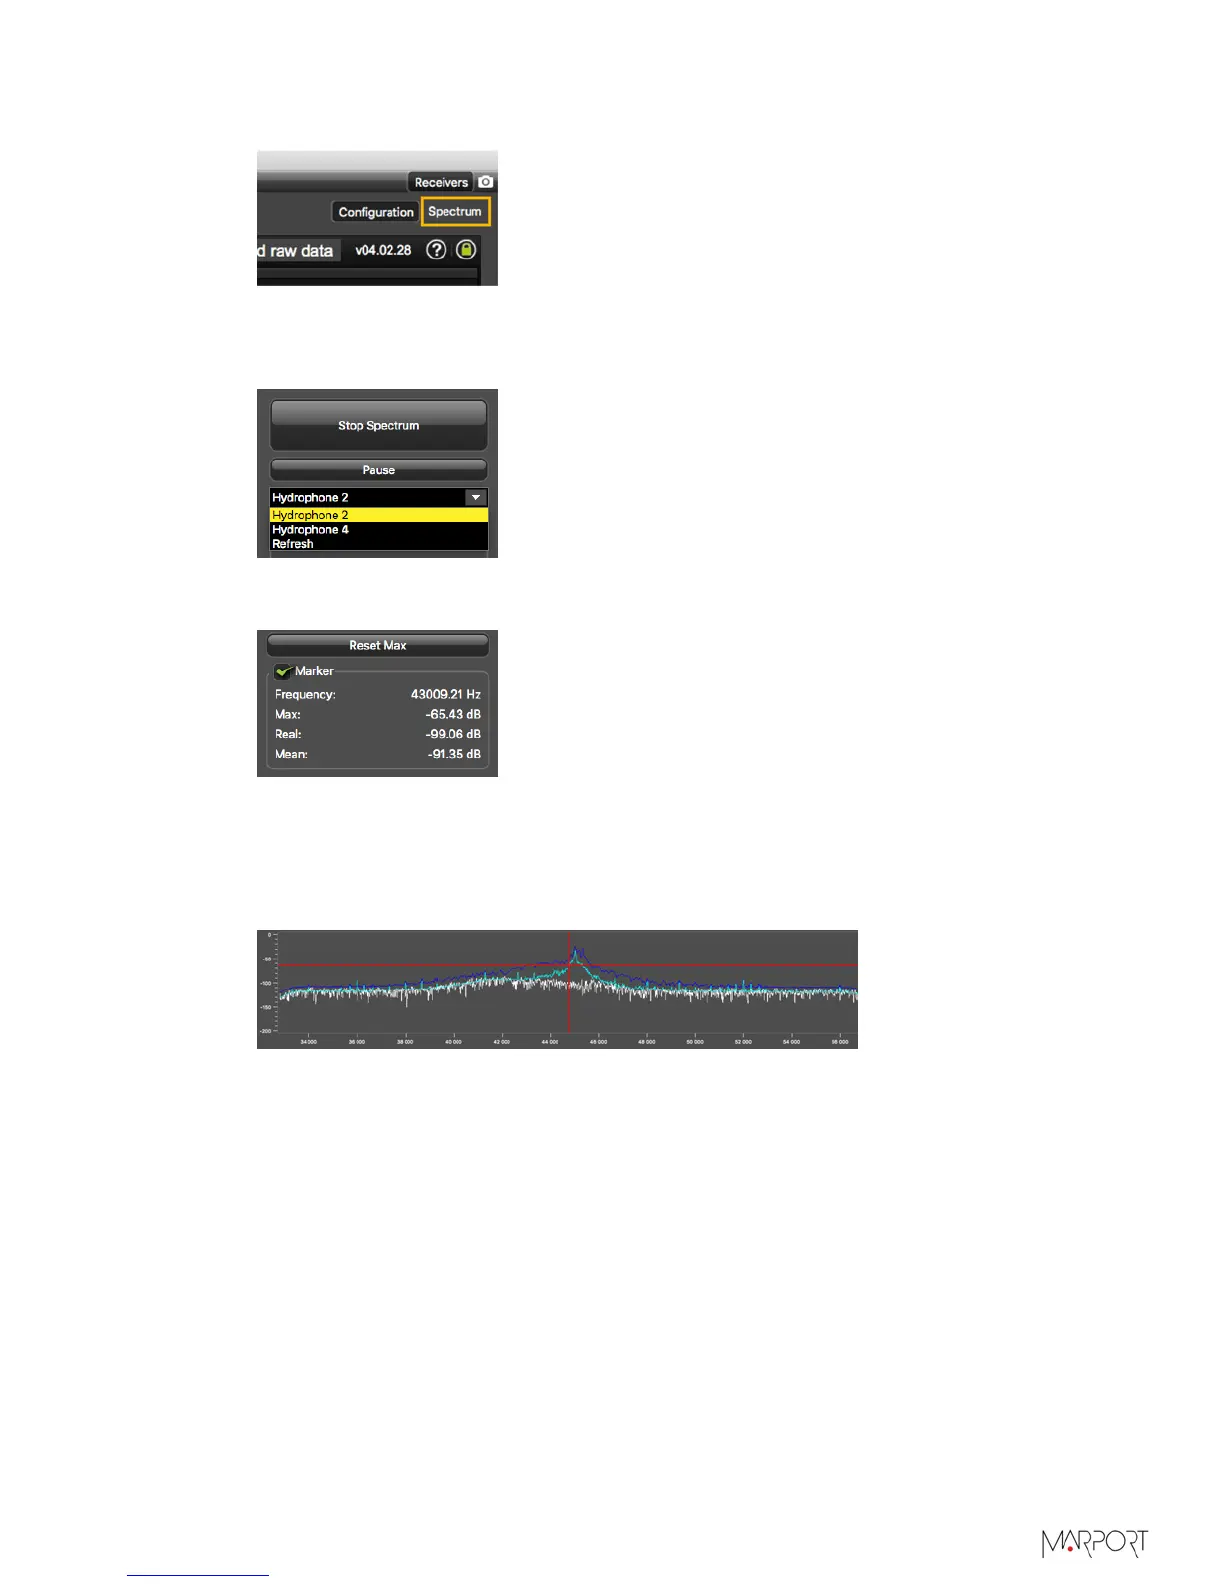
From the top right corner of the screen, click Spectrum.
4.
From the top left corner of the screen, click Start Spectrum.
5.
Select the hydrophone you want to test. Only the hydrophones that are switched on
are displayed. Select refresh to update the list.
6.
To check the maximum, mean and real measures of noise level at a specific frequency,
select Marker on the left side of the screen.
7.
Click the plot at the bottom of the screen to display the marker, made of two crossing
red lines. Move your mouse over the plot to place the marker on a frequency.
The noise levels are displayed under the part Marker. Use the marker to see at which
frequencies sensors are transmitting and at which frequencies the signal noise is
higher. Look at the Max and Mean measures of the noise level.
The acceptable average level of noise depends on the conditions (distance from the
sensor to the hydrophone, fishing method, type of hydrophone). You can have better
performance with the following levels:
• Active wideband hydrophone with high gain, or narrowband: below -80 dBV
• Active wideband hydrophone with low gain: below -100 dBV
• Passive hydrophone: below -110 dBV
8.
Click Reset Max to reset the maximum value.
9.
Check that there is more than 12dBV between the maximum noise level (dark blue
line) and the average noise level (light blue line) on the peak of the sensor frequency.
10.
Data displayed in Peak is the higher noise level coming from sensors signals and their
frequency. RealTime is the last peak recorded, and Max is the highest peak since the
spectrum is recording.
11.
To save data recorded by the spectrum in a *.txt file, click Save FFT.
| 58