HELIOS LED Processing Platform - USER GUIDE 35
EOTF Adjustments (continued)
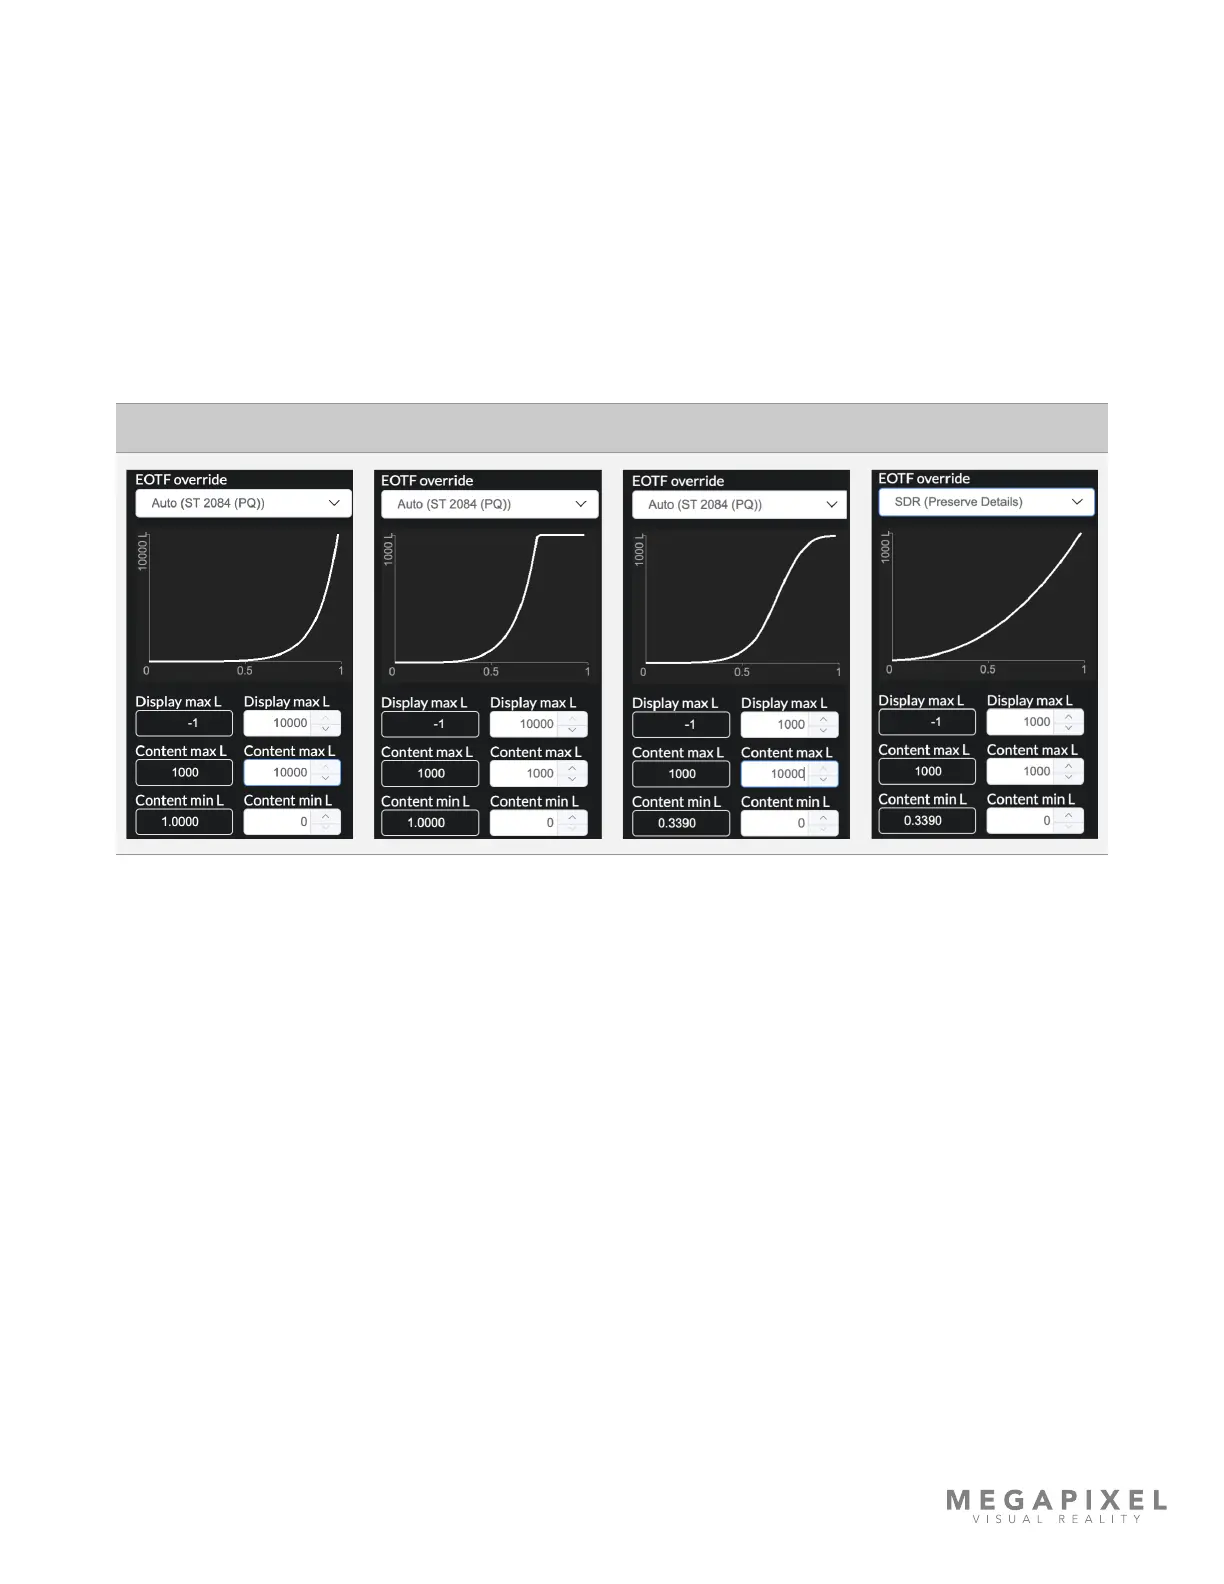
The PQ curve is dened in nits. As such, PQ content reports a max L (luminance) to HELIOS. In other words, PQ content
needs to be displayed at the brightness level at which it is mastered. The graph below the drop down is provided to help
explain the relationship between the content max L and display max L. If there is a max L mismatch between the content
and the display, the graph shows how the mismatch is being handled.
Example (A) - display max L and content max L are both 10,000 nits.
Example (B) - display max L is 10,000 nits, content max L is 1,000 nits. HELIOS can show all the content directly 1:1.
Example (C) - display max L is 1,000 nits, content max L is 10,000 nits. HELIOS introduces rolloff to preserve highlights.
Example (D) - HELIOS will also show the curves of SDR and other supported transfer functions.
Figure 42: EOTF max L graph examples
A B C D