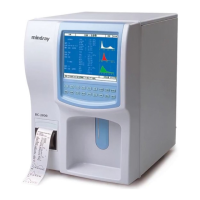
Histograms and Pulse Graphs
4.2 Pulse Graphs
After each count, the system can save the original sampling pulses of this time. We can
analyze the reason leading to the fault by viewing these original data.
Common pulse graphs
Enter password “3210”, after a count, you can view the WBC pulse graph of this
count by pressing “1” and RBC pulse graph by pressing “2” and PLT pulse graph
by pressing “3”. Press “ENTER” to exit.
When the instrument is working normally, the length of pulse data is related to
the concentration of the blood sample. The length of the pulse data should be
within a limit range. For general samples, the range should be: WBC: < 1M
RBC: < 600K PLT: < 1M
Data length of abnormal sample will not lie in this range.
Length of normal level controls data should be:
WBC:400 ~ 700K RBC:250 ~ 450K PLT:300 ~ 600K
Normal pulse graphs
Figure 4-12 WBC pulses
Figure 4-14 RBC pulses
Figure 4-13 PLT pulses
Figure 4-15 Normal WBC background
pulse
BC-2800 Auto Hematology Analyzer (V1.0) 4- 3

 Loading...