33
Displays associated with oxygen and the O2 Bar Graph will
be displayed if FO2 has been set at a value other than 'Air'
(e.g., a numerical value) and the Alternate screen that displays
oxygen related data is accessed.
When the oxygen data screen is accessed during a NORM
dive, the Bar Graph will show the maximum of either per dive
accumulated oxygen or 24 hour period accumulated oxygen.
As your oxygen exposure (accumulation) increases during a
NORM dive, segments will add to the O2 Bar Graph, and as
saturation decreases, it will begin to recede, indicating that
additional exposure is allowed for that dive and 24 hour
period.
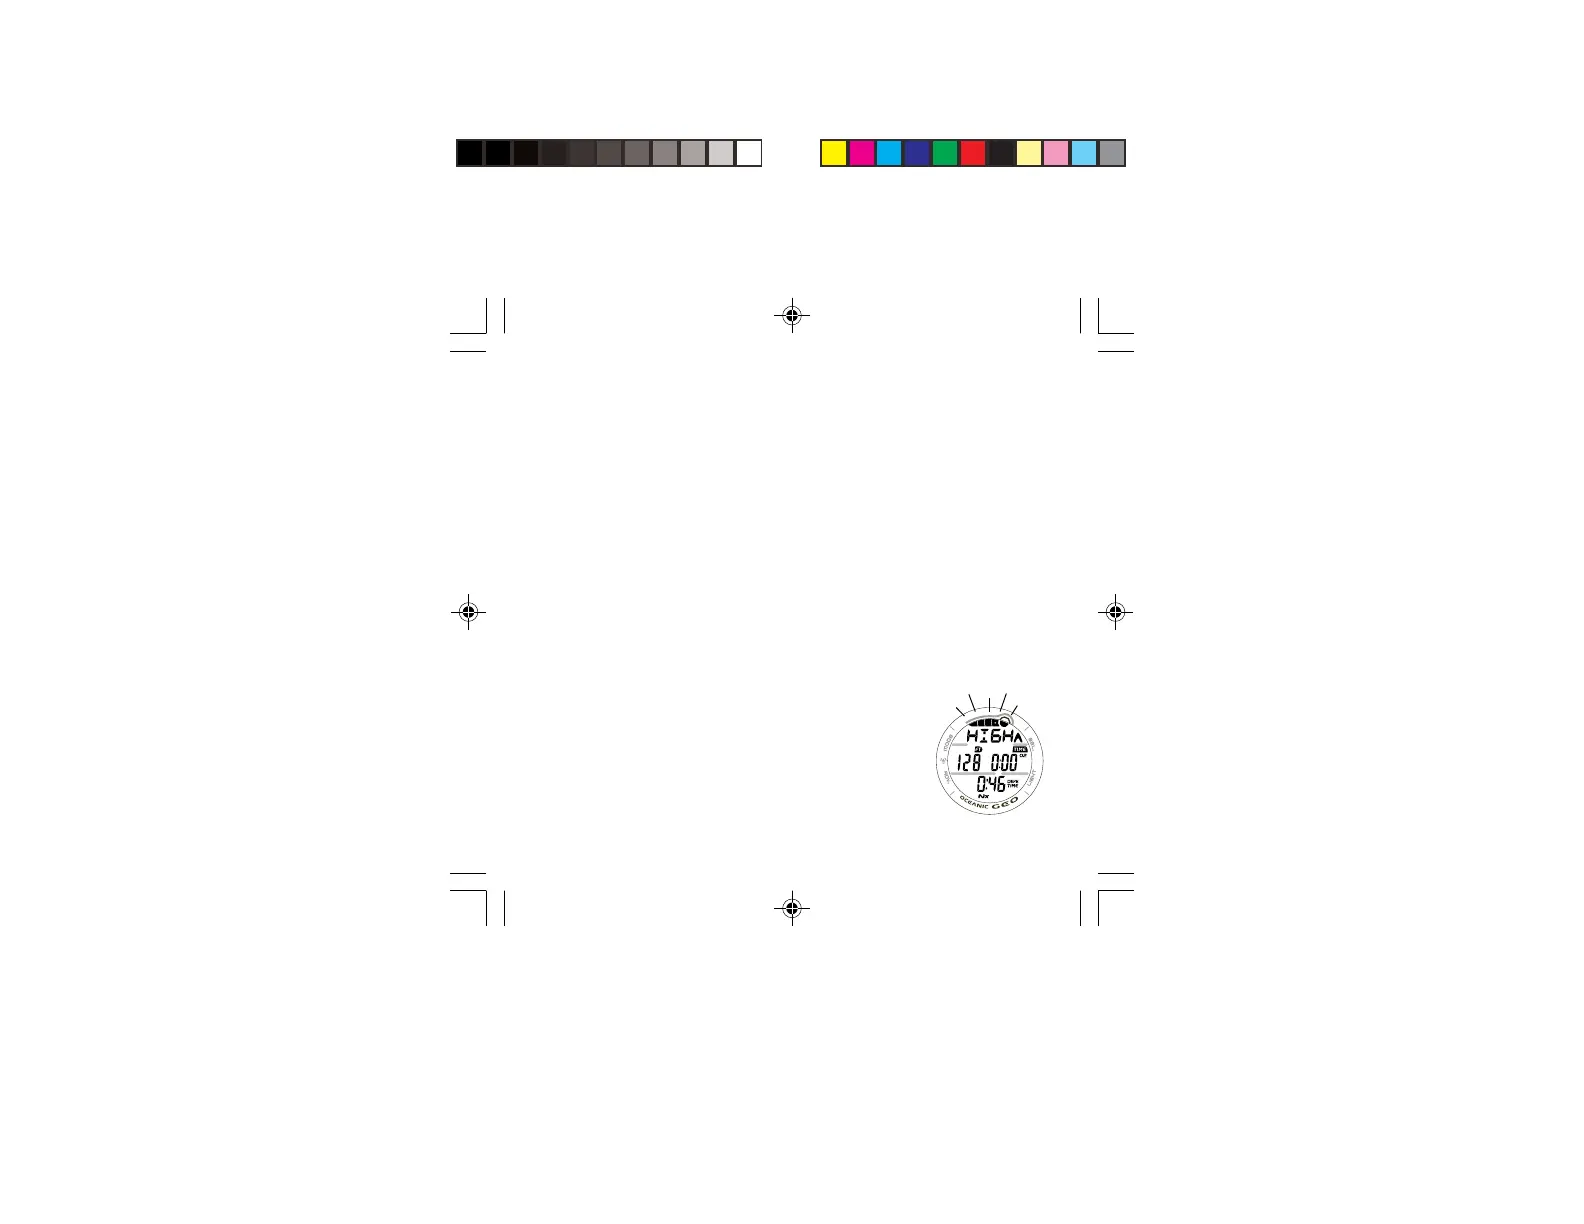
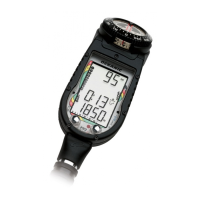
The GEO will store oxygen accumulation calculations for up to
10 dives conducted during a 24 hour period. If the maximum
limit for NORM dive oxygen loading has been exceeded for
that day (24 hour period), all of the segments of the O2 Bar
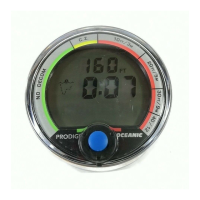
Graph will be displayed flashing (Fig. 25).
Depth/Time values will not appear in Plan Mode until the O2
Bar Graph recedes into the normal zone (4 segments) indicat-
ing that your daily oxygen dosage has decreased an amount
equivalent to the amount accumulated during the latest dive
completed.
Fig. 25 - O2 EX-
CEEDED