Otoport OAE+ABR
User Manual for Otoport DP+TE model
79
TEOAE test
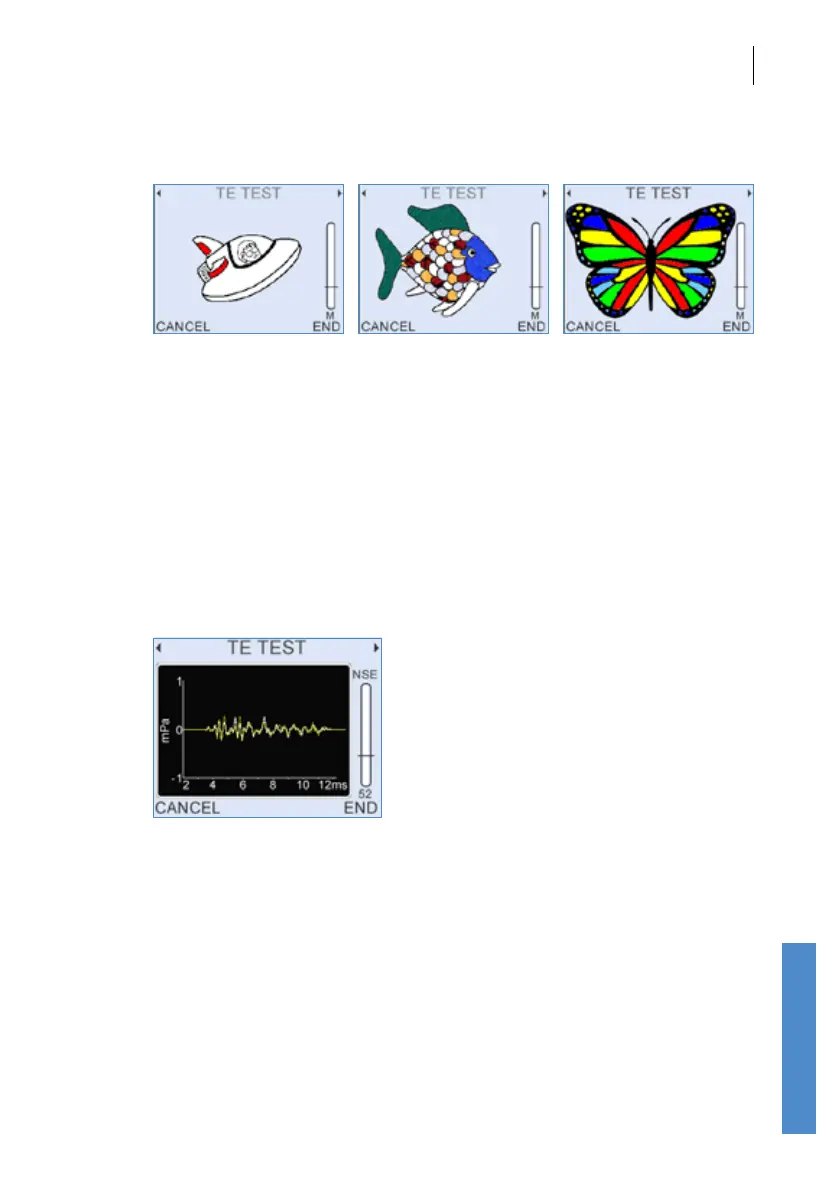
9.2.3 Infant distraction screens
These screens are designed to encourage young patients to keep still and
quiet during OAE testing.
They show a simple drawing that becomes more colourful if they are quiet.
The quieter they are the more quickly the picture progresses. If they
become noisy then the colour in the picture starts to fade.
A number of alternative images are available. Choose between the images
with the number keys (1-3).
This is an optional feature in some regions.
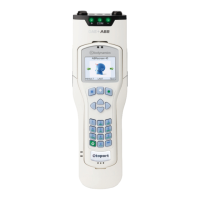
9.2.4 Response waveform
The response waveform screen displays the two interleaved OAE
waveforms (named A and B). Waveform A is shown in orange and
waveform B in yellow. Waveforms that correlate well represent good
quality recordings with low noise. Signicantly dierent waveforms indicate
a noisy recording. As the test continues the noise levels will be reduced by
averaging and the two waveforms will show better agreement. Examining
the waveforms can help troubleshoot testing problems. Typical TEOAE
response waveforms have energy distributed across the response window
with the higher frequencies appearing early in the response window and
low frequencies later. Waveforms dominated by a single frequency may
be the product of strong spontaneous OAEs. Waveforms dominated by
a single frequency which decays rapidly may be due to a faulty probe or
a ringing stimulus. If you are concerned about the performance of your
Otoport, run the system QA tests (see chapter 17 Quality tests).