CHAPTER NINE
TEOAE test
80
TEOAE test
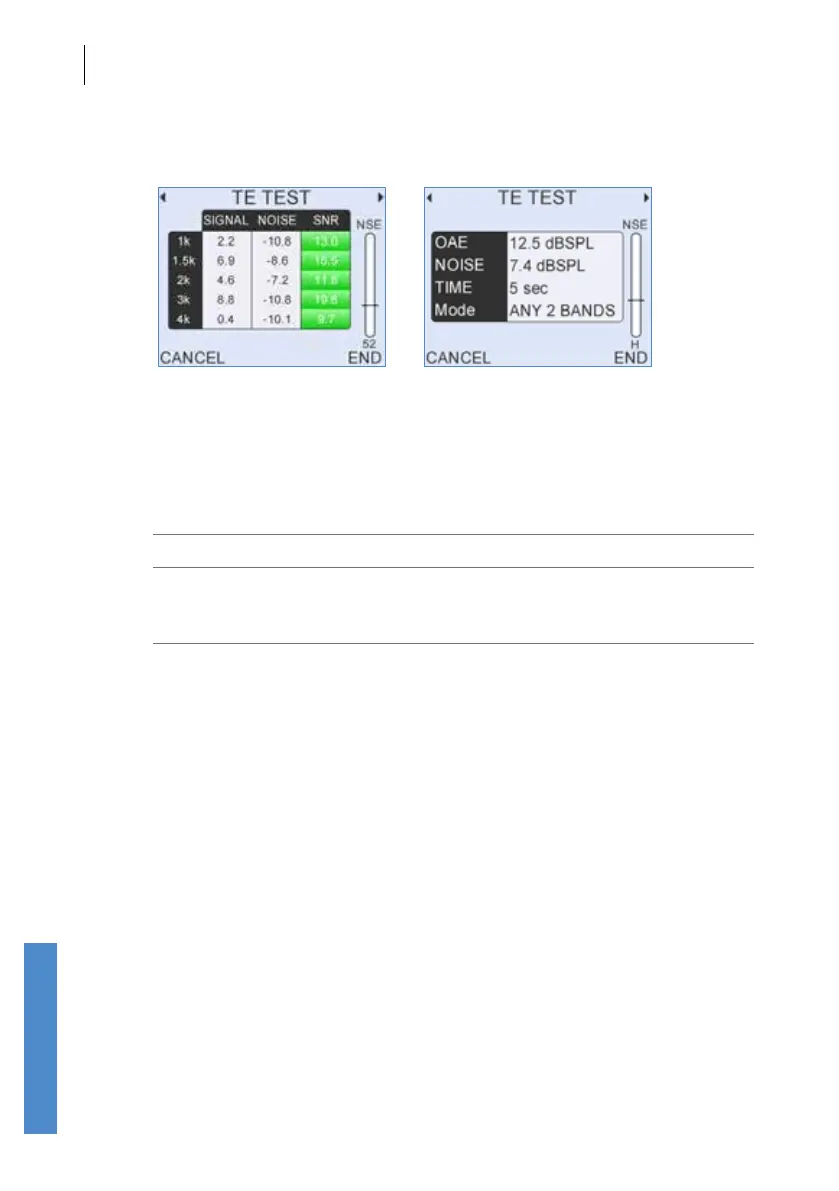
9.2.5 Data tables
Two data tables may be accessed during the test by pressing right or left
arrow keys.
The rst data table displays the dB levels at the specied half octave
frequencies.
Signal The signal level recorded in dB SPL
Noise The Noise levels recorded in dB SPL
SNR The Signal-to-Noise Ratio (SIGNAL minus NOISE dB);
a dash (-) indicates no data has been collected at that
frequency
The second data table displays the current total OAE, the total noise, the
test duration and the current test mode. It can be accessed during the test
by pressing right or left arrow keys.
9.2.6 Noise level indicator
A Noise Level Indicator is shown on the right of the Checkt screen. The
bar moves in response to changes in noise. For good testing conditions
the bar should be consistently below the Noise Reject Level, which is
represented by the horizontal line across the Noise Level Indicator. The
bar is lled red if the level is above the threshold and green if it is below.
The noise level shown is calculated from the peak sound level recorded
within each response window.
The letter below the indicator represents the noise reject threshold level.
This can be altered using the up and down arrow keys.
The noise level indicator allows continuous monitoring of the noise level
during a test.