CHAPTER TEN
ABR test
92
ABR test procedure
NHi/NLo
NLo shows the number of sweeps accepted into the average. NHi shows
the number of sweeps rejected due to high electrical noise levels.
Accepted
Shows the number of sweeps accepted into the average.
Rejected
Shows the number of sweeps rejected due to high electrical noise levels.
ABR Noise
Shows the estimate of residual noise in the averaged response that is used
in the Fsp calculation.
If the signal which has been recorded is very small (<15nV), and no sign of
an ABR has been detected, the test will stop automatically with a ‘No Valid
ABR’ result as continuing the test would not nd an ABR present.
If ABR noise is too high (>85nV), a valid ABR cannot be detected, so the
test will continue to run even if other pass criteria are met.
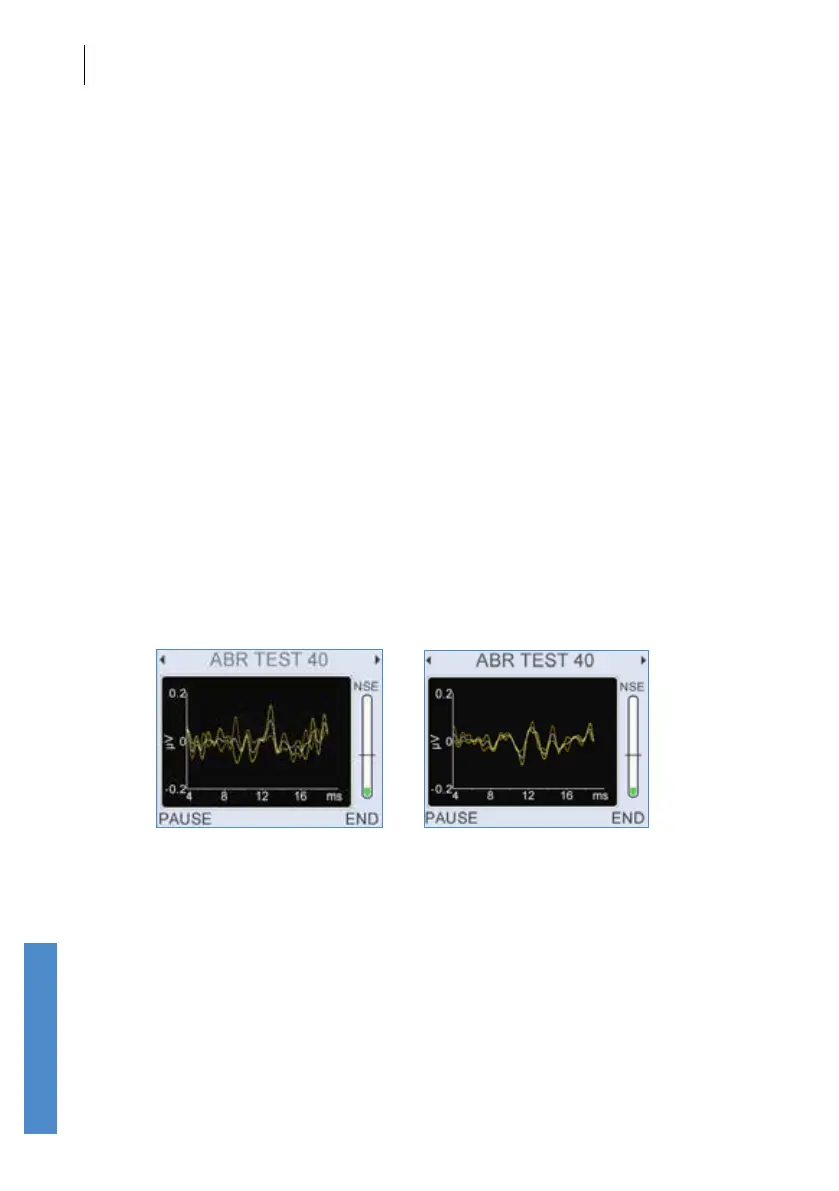
10.4.2 Waveform display
Noisy ABR Good ABR
This screen shows the averaged ABR waveforms collected. Two
waveforms are collected from interleaved averages so that the correlation
between the two can be assessed. Close agreement between the
waveforms indicates that a clear response is present (right), disagreement
between them shows the presence of noise (left). Excess noise may
obscure an ABR. The alternative waveforms are displayed in orange and
yellow. The average of these two waveforms is shown in white.
The Fsp and template correlation (TC) measures are based on the nal
average (the white line), not on the subaverages.