4 ECG and Arrhythmia Monitoring Monitoring View
48
Monitoring View
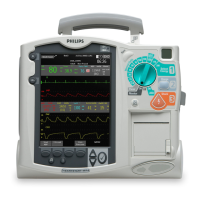
Monitoring View appears on the display when the Therapy Knob is in the Monitor position. Figure 30
shows the information displayed in Monitoring View.
Figure 30 Monitoring View
Monitoring View can display up to four ECG waves. Numeric values for heart rate and all other
available parameters are displayed, as well as any active alarm settings.
E
C
G/
HR
a
l
a
r
m
s
Mark Event
10 Feb 2006 11:20
Patient Name
A
dul
t
N
on
-
P
ace
d
I
nop
s
A
r
ea
02:42
36.9 80
120/80
(95)
P
ul
se
NB
P
mm
H
g
q
120
10
:
40
bp
m
C
T
e
m
p
SYS
160
90
II
HR
bp
m
80
120
50
39
.
0
36
.
0
S
p
O
2
%
E
t
C
O
2
100
A
w
RR
mm
H
g
r
p
m
P
A
P
AB
P
150
75
0
AB
P
P
A
P
30
15
0
C
O
2
60
30
0
160
SYS
118/77
(95)
mm
H
g
mm
H
g
90
24/10
(15)
16
D
I
A
0
100
90
38
50
30
18
30
8
S
t
a
r
t
NB
P
12
-
L
ea
d
Z
e
r
o
M
E
NU
P
r
ess
 Loading...


