6.4-5
Section 6
ApplicAtions
Pinnacle Operators Manual
Pickering Laboratories Inc.
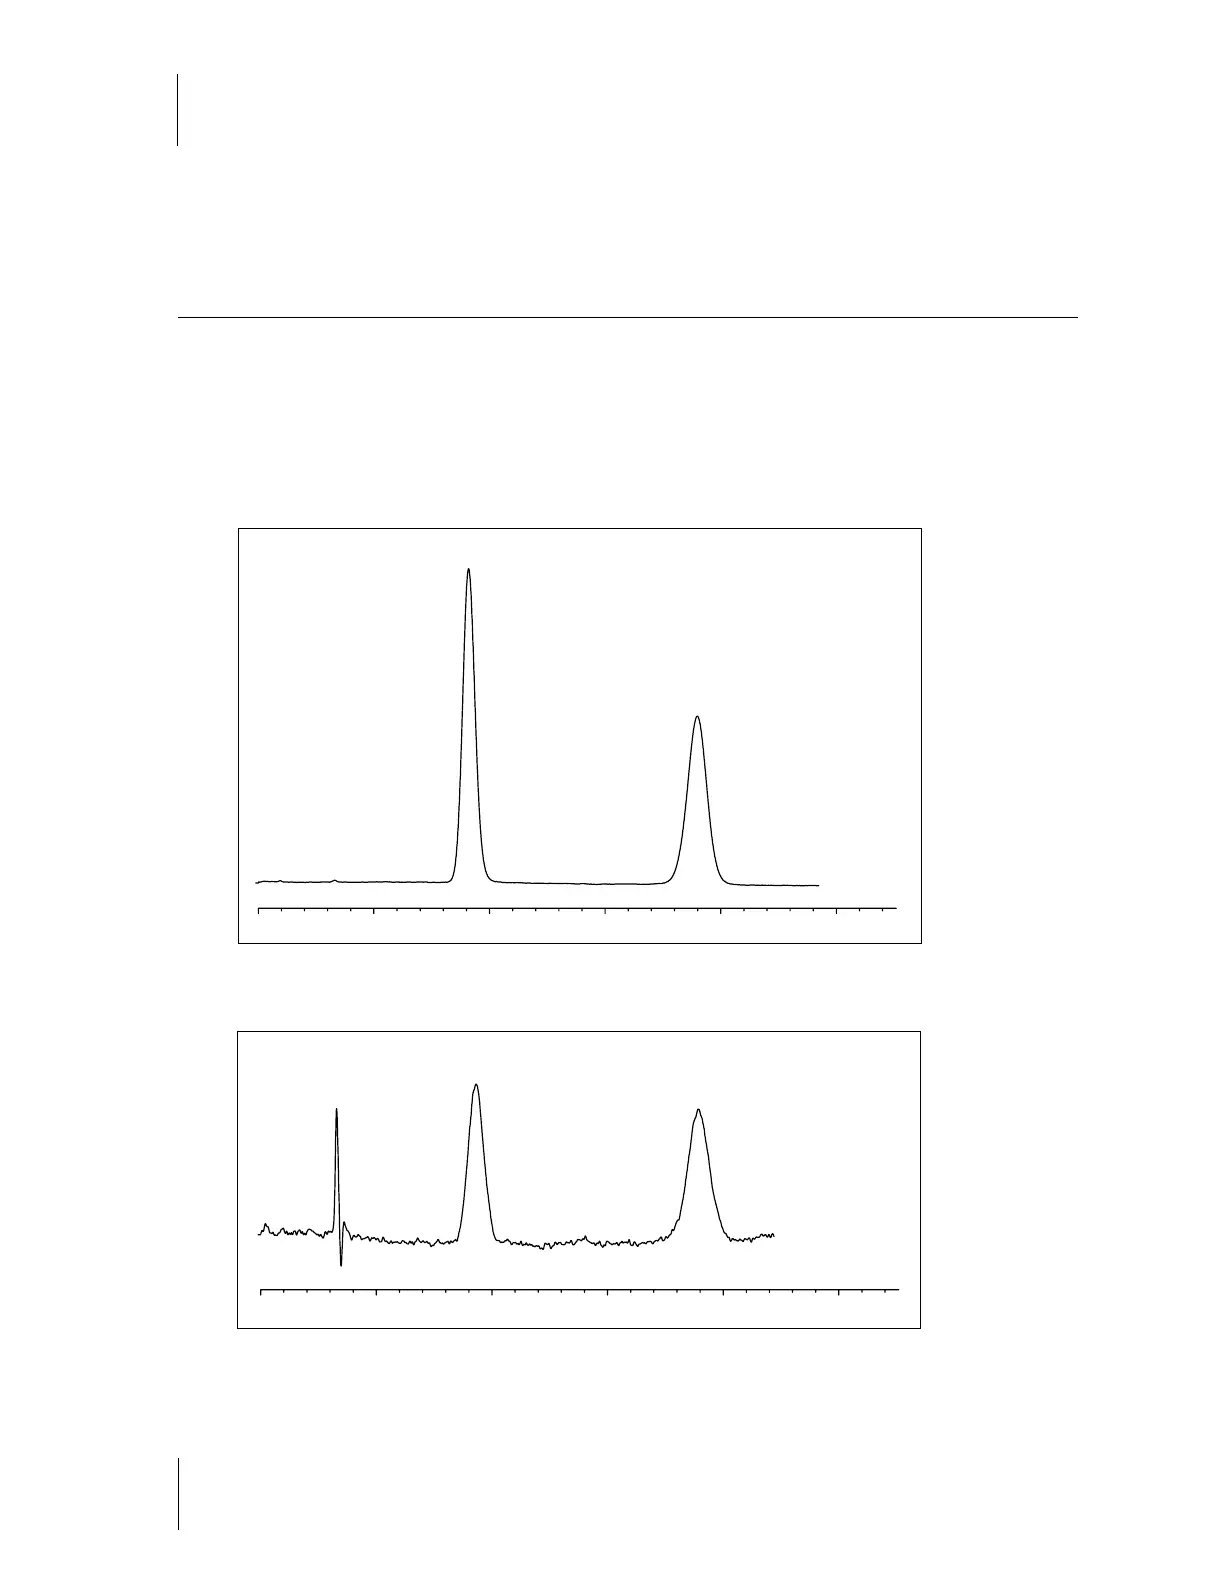
Figure 6.4-C shows a typical Glyphosate and AMPA chromatogram. In a standard with Glyphosate and AMPA
at equal concentration, the peak heights should be equal. The peak heights are influenced by the amount of
hypochlorite in Reagent 1.
Sample Chromatograms
Glyphosate Test Mix, 2.5ppm, 10μl injection
Glyphosate and AMPA, 13ppb in K200, 100μl injection
Glyphosate
AMPA
0
10 20
min
Glyphosate
AMPA
0
10 20
min
Figure 6.4-C
Figure 6.4-D