COMPUTER INTERFACE
5-25
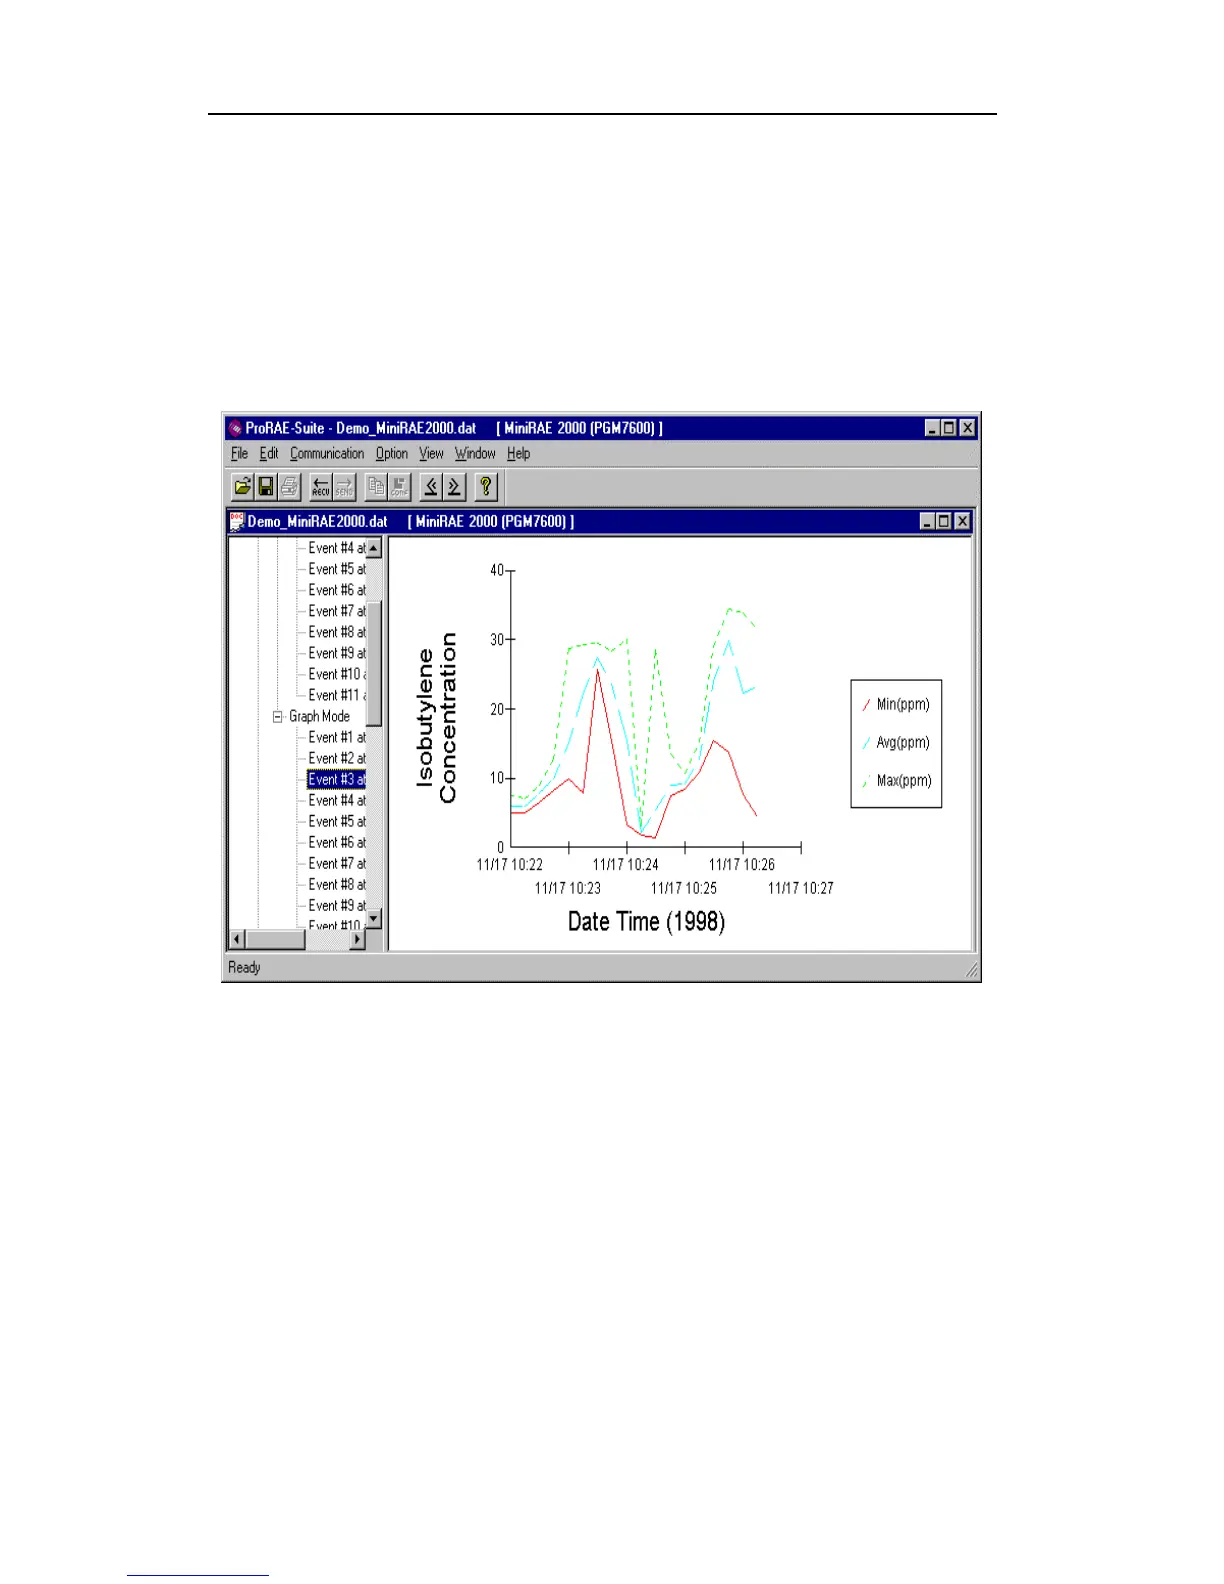
5.6.5 View Logged Data in Graph Mode
To view the logged data of a specific event in graph
mode, click the event item under the tree item Graph
Mode in the left pane, and the right pane displays the
graph of that event, as shown in Figure 5-11.
Figure 5-11 Graph of the Logged Data
Select graph type:
The user can choose the type of data in the Graph Type
tab page of the Graph Settings dialog box. To display
the Graph Settings dialog box, click any place in the
right pane so that pane is active, then click the Option-
>Graph Settings menu item to display the Graph
Settings dialog box. Figure 5-12 shows the Graph Type
tab page of the Graph Settings dialog box.