COMPUTER INTERFACE
5-26
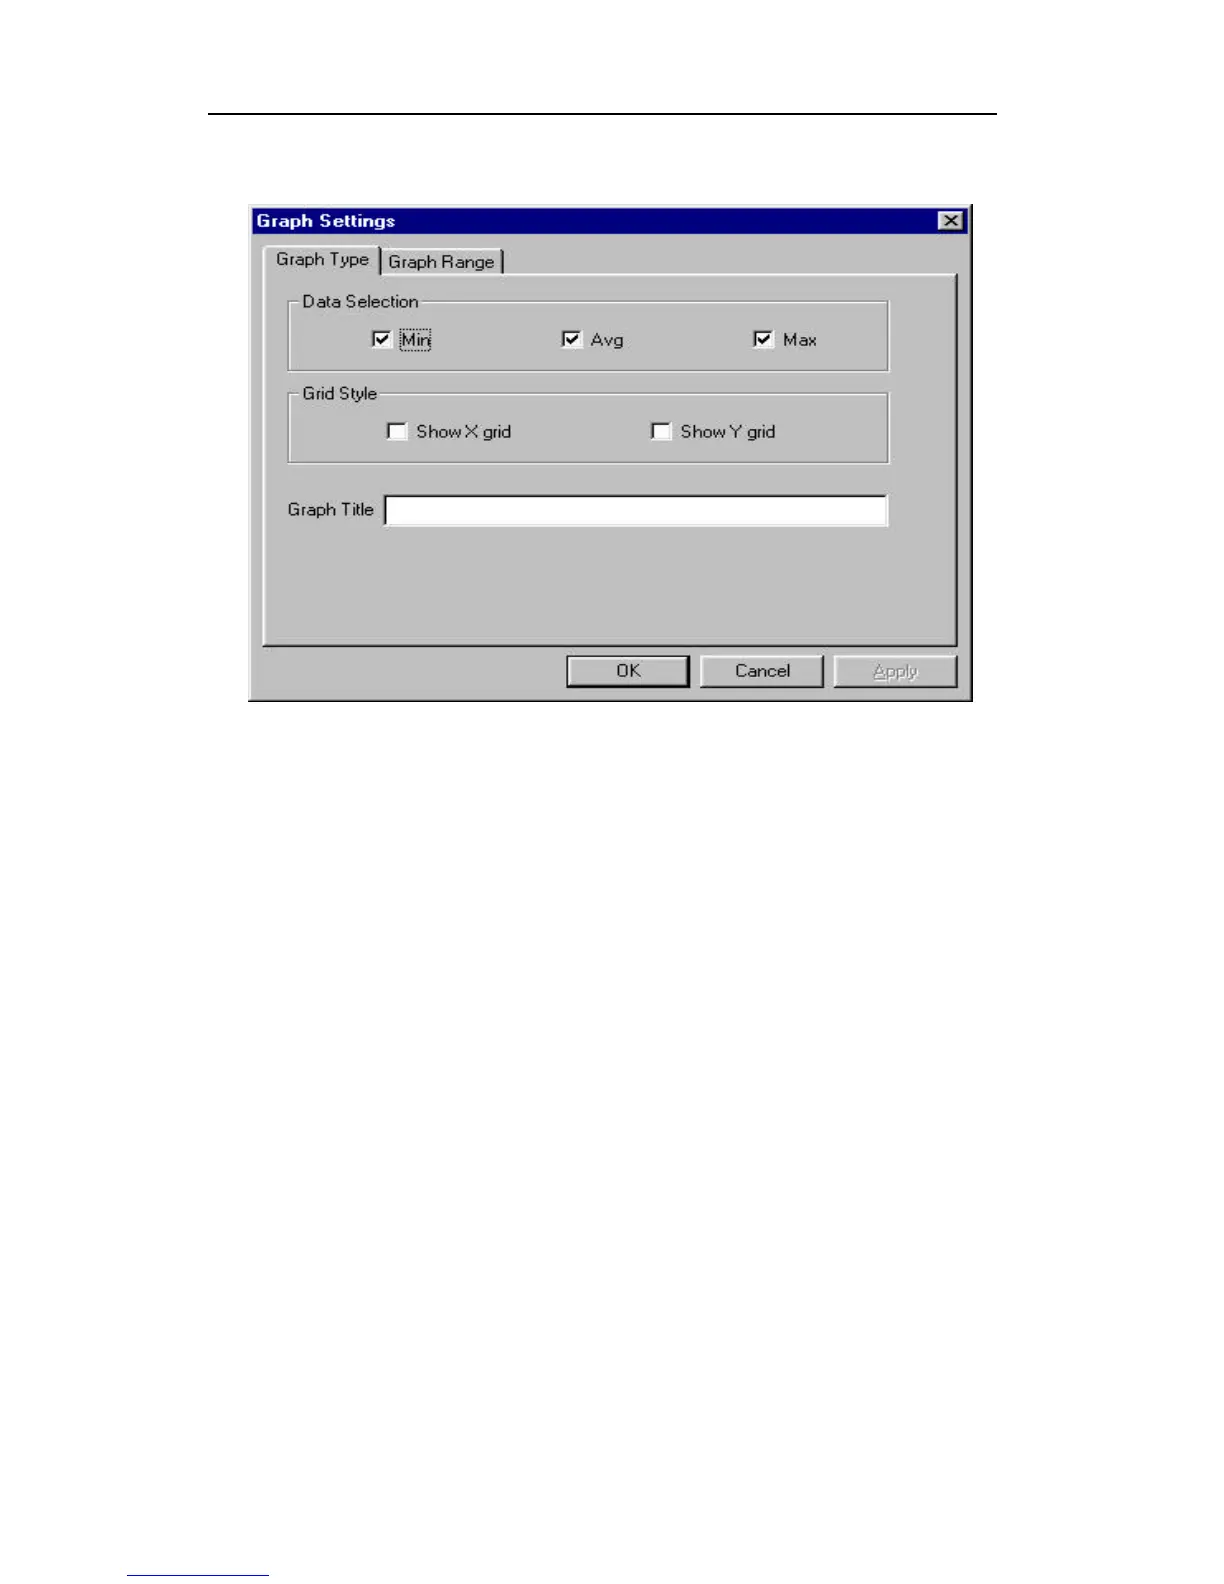
Figure 5-12 Graph Type Tab Page
Select graph range:
User can choose the value range on the x-axis and y-axis
in the Graph Range tab page of the Graph Settings
dialog box. To display the Graph Settings dialog box,
click any place in the right pane so that pane is active,
then click the Option->Graph Settings menu item to
display the Graph Settings dialog box. To activate the
Graph Range tab page, simply click the page header of
the Graph Range tab page. Figure 5-13 shows the
Graph Range tab page of the Graph Settings dialog
box. The graph ranges for the x-axis and y-axis are then
entered on this screen.