RAUMED NeuroSmart Instruction Manual
Manufacturer: RAUMEDIC AG, Hermann-Staudinger-Strasse 2, 95233 Helmbrechts, Germany
zwo-541EN Rev 3 / 2022-05-03
Page 24 of 61
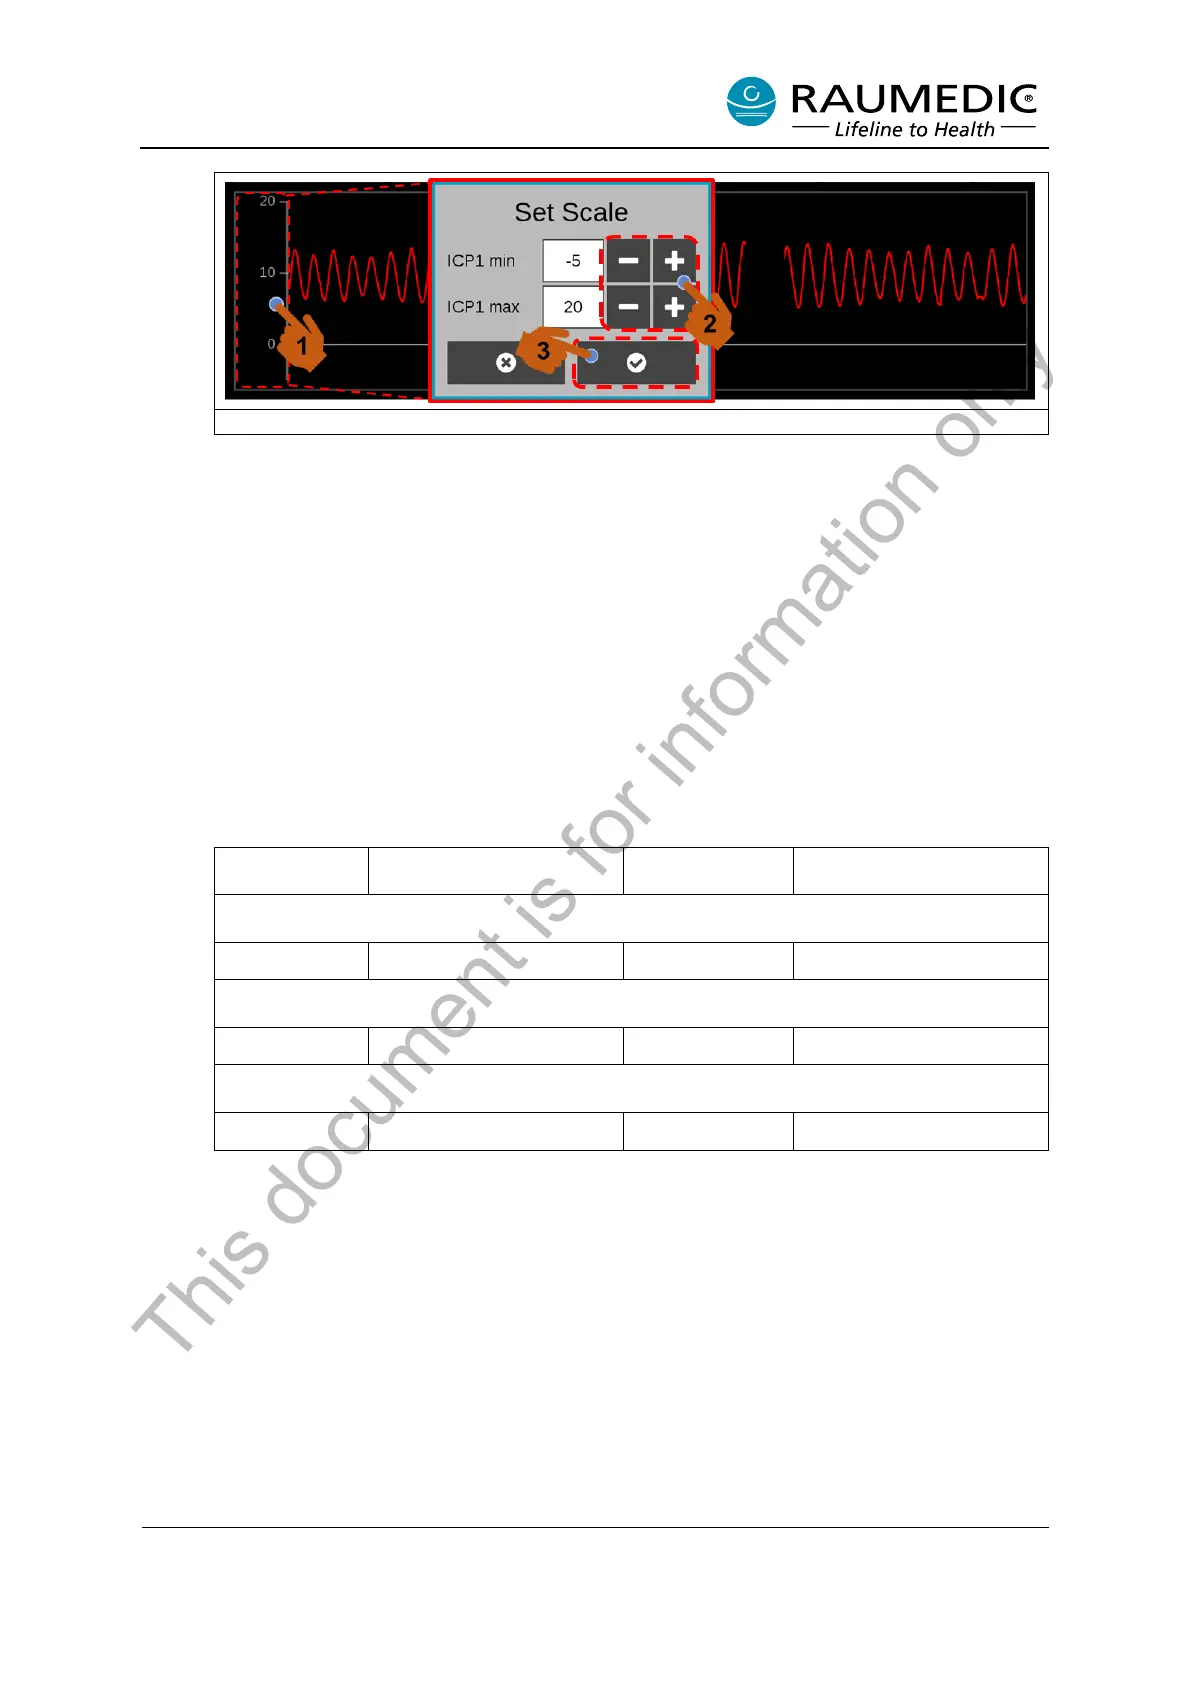
Figure 12: Adjusting user-defined axis scaling in the Live Graph
• Scale Graph Trend
Except for the “Autoscale” function, compared to the Live Graph View, all other scaling options are
available in the Trend Graph View.
o Auto-scaling: not available
o Setup 1-3:
The scaling in the trend graph for Setups 1-3 is identical to the scaling in the live graph. See Table
9 - Table 11. The graphs for temperatures and CPP can moreover be displayed in the Trend View.
The scaling ranges of the various setups are shown in Table 12.
Table 12: Scaling ranges in trend graph
o User-defined: The user can specifically adjust the axis scaling for each location of measurement,
in the Trend Graph view.
To do this, please perform the following steps. See Figure 13.
<1> Press the axis of the particular measuring position <2> An input window appears and the
scaling range can be adjusted with the Plus/Minus button <3> Confirm the input.
This document is for information only