RAUMED NeuroSmart Instruction Manual
Manufacturer: RAUMEDIC AG, Hermann-Staudinger-Strasse 2, 95233 Helmbrechts, Germany
zwo-541EN Rev 3 / 2022-05-03
Page 25 of 61
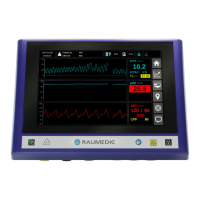
Figure 13: Adjusting user-defined axis scaling in the Trend Graph
• Display trends
Up to 6 trends can be displayed in the Trend Graph View. If fewer sensors are connected to the
NeuroSmart, fewer trends are accordingly available.
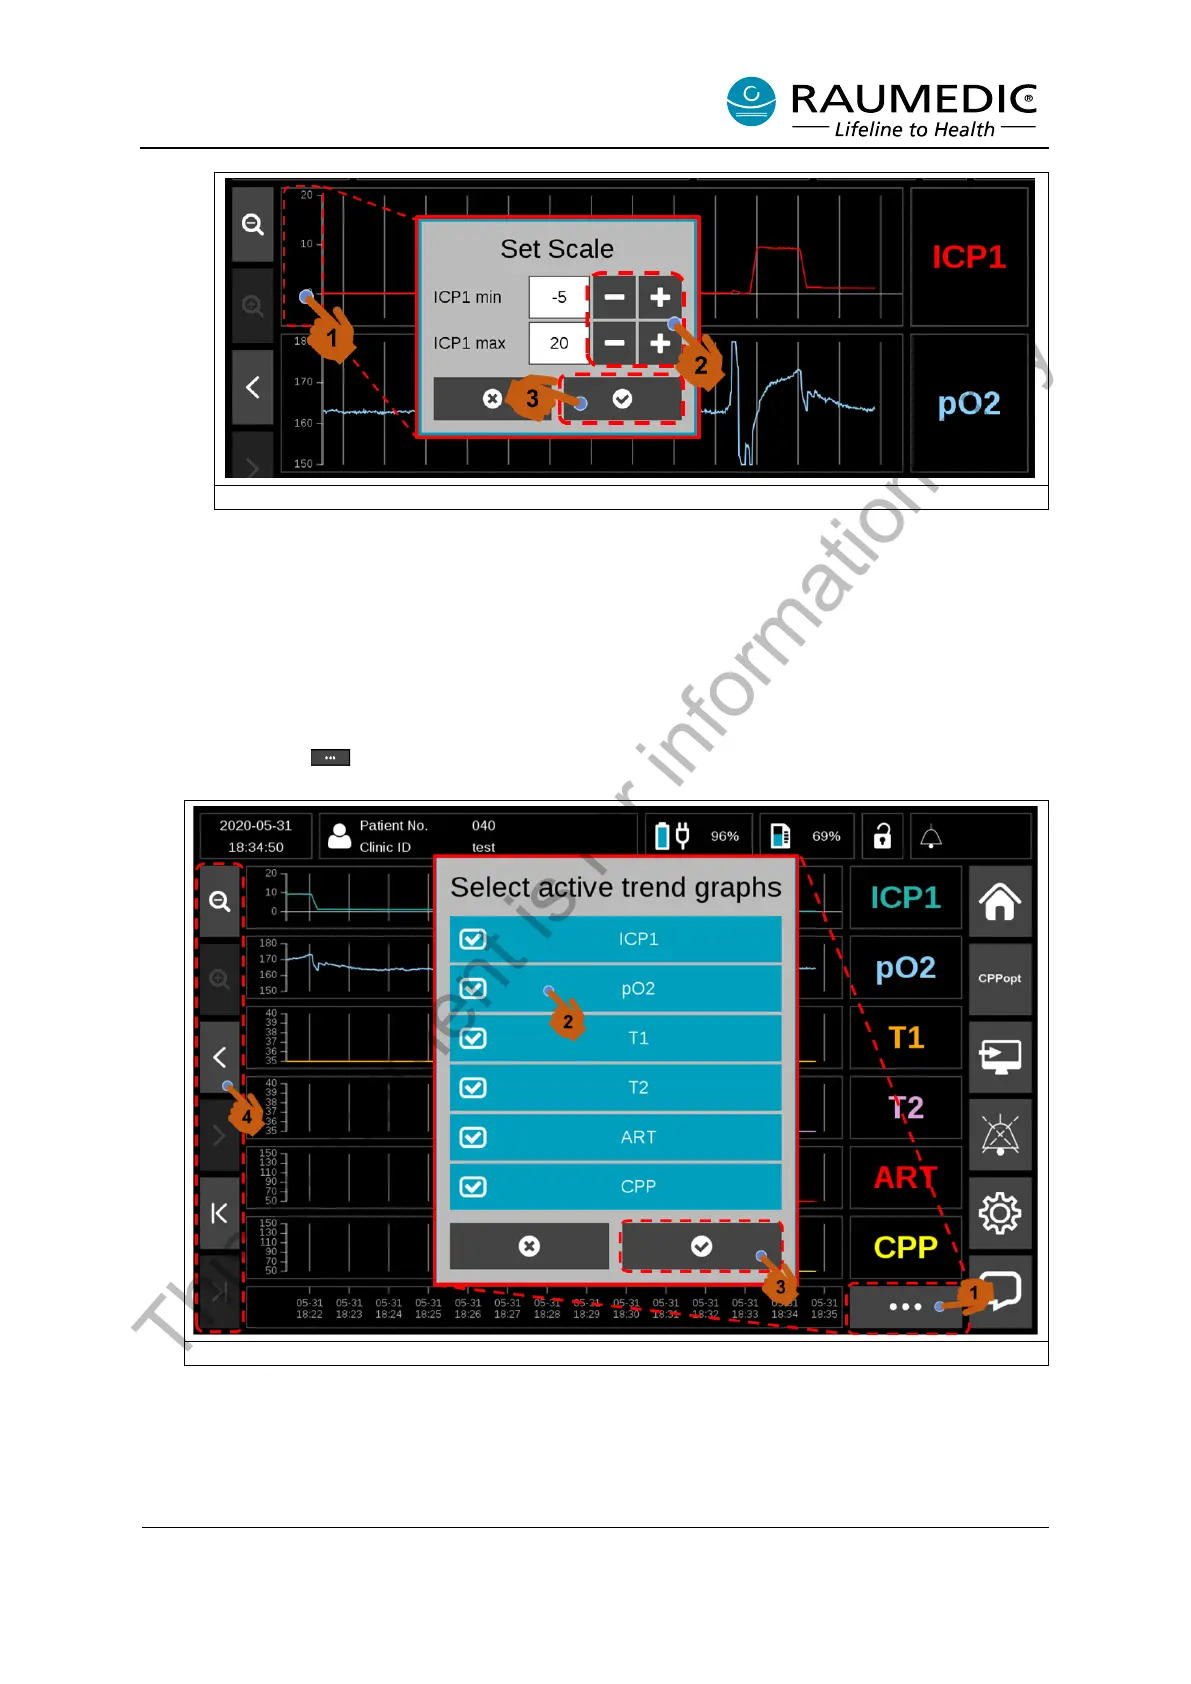
You can select the number of displayed trends. To do this, please perform the following steps. See
Figure 14.
<1> Press the button. A selection window with the available trends appears. <2> Activate or
deactivate the channels to make your selection. <3> Confirm the selection.
Figure 14: Select trends and adjust times in the Trend Graph View
<4> Soft keys are available on the left side of the display that can be used to adjust the displayed
chronological range of the trend. The individual soft key has the following functionality. See Table
13
This document is for information only