Image Adjustment
183
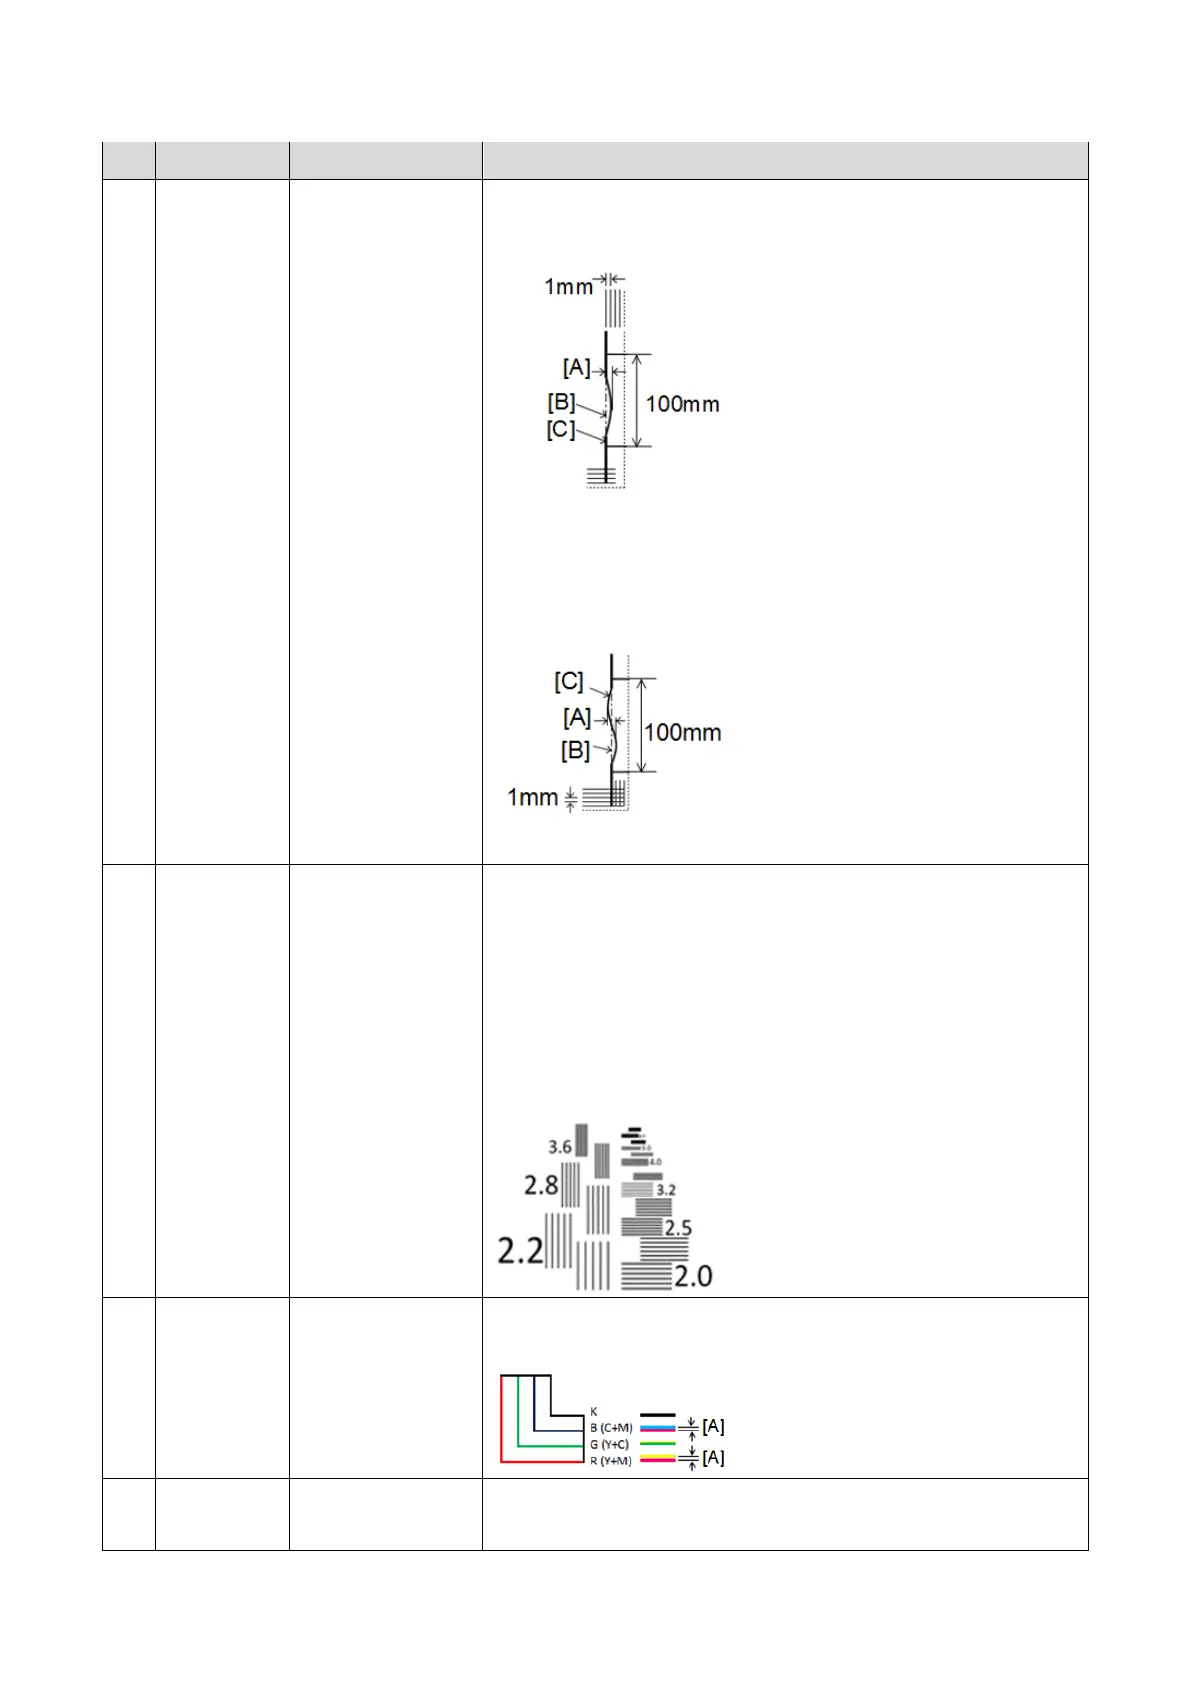
No. Check Area Check Item Description
distortion to the frame line, and measure the deviation length from
the baseline with the scale.
A: Measuring length, B: Base line, C:Copy
If meandering, measure the maximum amplitude. If difficult to
measure, draw an auxiliary baseline, measure the deviation length
from the baseline with the scale, and sum it up.
A: Measuring length, B: Base line, C:Copy
2 Cornfield
pattern
Resolution Check the number next to the finest set of lines that can be
distinguished from each other clearly, and do not blur into each
other. The intervals between lines in the chart are the following,
in 15 steps. A higher number means a finer image (higher
resolution).
2.0/2.2/2.5/2.8/3.2/3.6/4.0/4.5/5.0/5.6/6.3/7.1/8.0/9.0/10.0
[lines/mm]
3 Colored
L-shaped
lines
Color registration
errors
Check the distances [A] between the colors making up the RGB lines
(Y+M/ Y+C/ C+M), using a loupe.
4 Solid color
patches
Solid density Check the density of each color patch between the chart and the
copy .