46
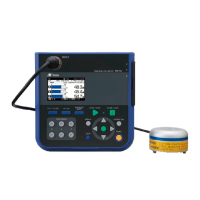
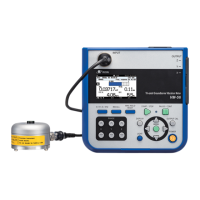
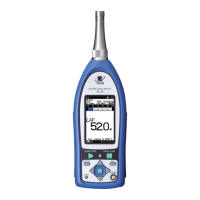
Reading the Display
Bar graph level range
Shows the upper and lower limit of the bar graph. The range can be
changed using the LEVEL RANGE key on the control section.
Overload indication
When a signal overload condition of the vibration level or the vibration
acceleration level is detected, the indication (white on black) is
shown for at least 1 second.
If processed data contain signal overload data, the indication is
shown. This indication remains on the processed data display screen until
the next processing measurement is started.
Bar graph
Shows the vibration level or the vibration acceleration level as a bar graph
indication. (The display is updated every 100 msec.)
Comparator
When the comparator function has been set to ON, the comparator level
is shown as an orange line on the bar graph. When a signal exceeds that
level, the indication [Comp] appears, and a signal is output from the I/O
connector on the right side panel (see page 38).
Note
When the optional Extended Function Program
VX-55EX is not installed, the comparator cannot
be selected.
L
v
value / L
va
value display
Shows the measured vibration level or vibration acceleration level. (The
display is updated every second.)
Level range settings
Shows the upper limit of the level range (X, Y, Z). is shown here
when a signal overload condition has been detected, and is shown
when a signal under-range condition has been detected.