32 WiNG-MGR User Guide 800.518.1519
3 Web Interface
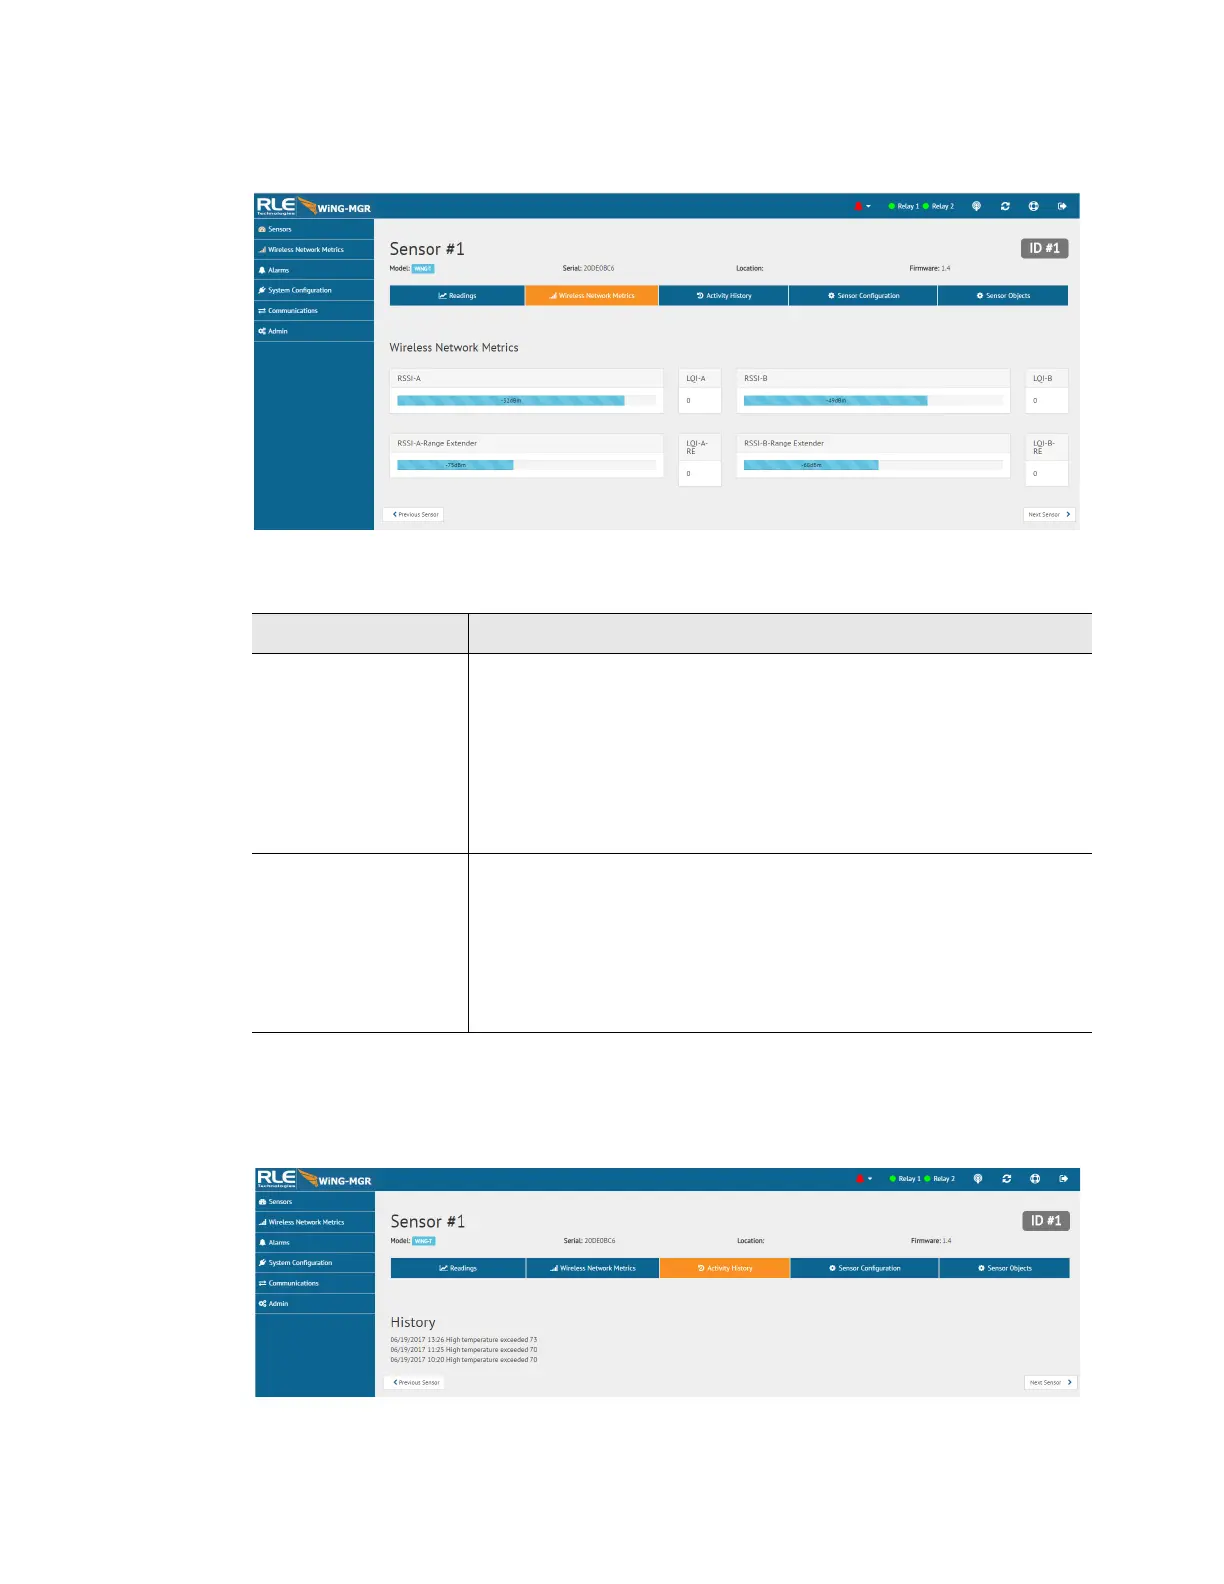
Independently, the RSSI and LQI variables don’t provide much insight. But you can use them
together, over time, to maximize the performance of your wireless network.
Figure 3.9
Individual Sensor Page - Wireless Network Metrics Tab
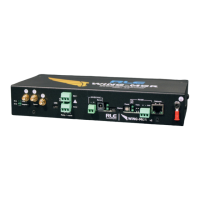
3.2.1.3 Activity History
This page shows the activity history for this sensor.
Figure 3.10
Individual Sensor Page - Activity History Tab
Attribute Description
RSSI This is the Received Signal Strength Indicator. It represents the
received power of the signal. This number will always be a negative
value.
To maximize the performance of this system, get the RSSI value as
close to zero as you can. If you are working to maximize this WiNG
system, the RSSI value will likely plateau close to -30. The closer
you can get your reading to -30, the better performance you’ll see.
LQI This is the Link Quality Indicator. It is an indication of the level of
noise that’s disrupting the radio. This number will always be a
positive value.
To maximize the performance of this system, work to get this value
as close to zero as possible. High LQI values - above 25 or 30 -
indicate a noisy environment.
Table 3.3
Wireless Network Metrics Field Descriptions