Chapter 3 Functional descriptions
SMSO-2-02.03- 15.07.03 57
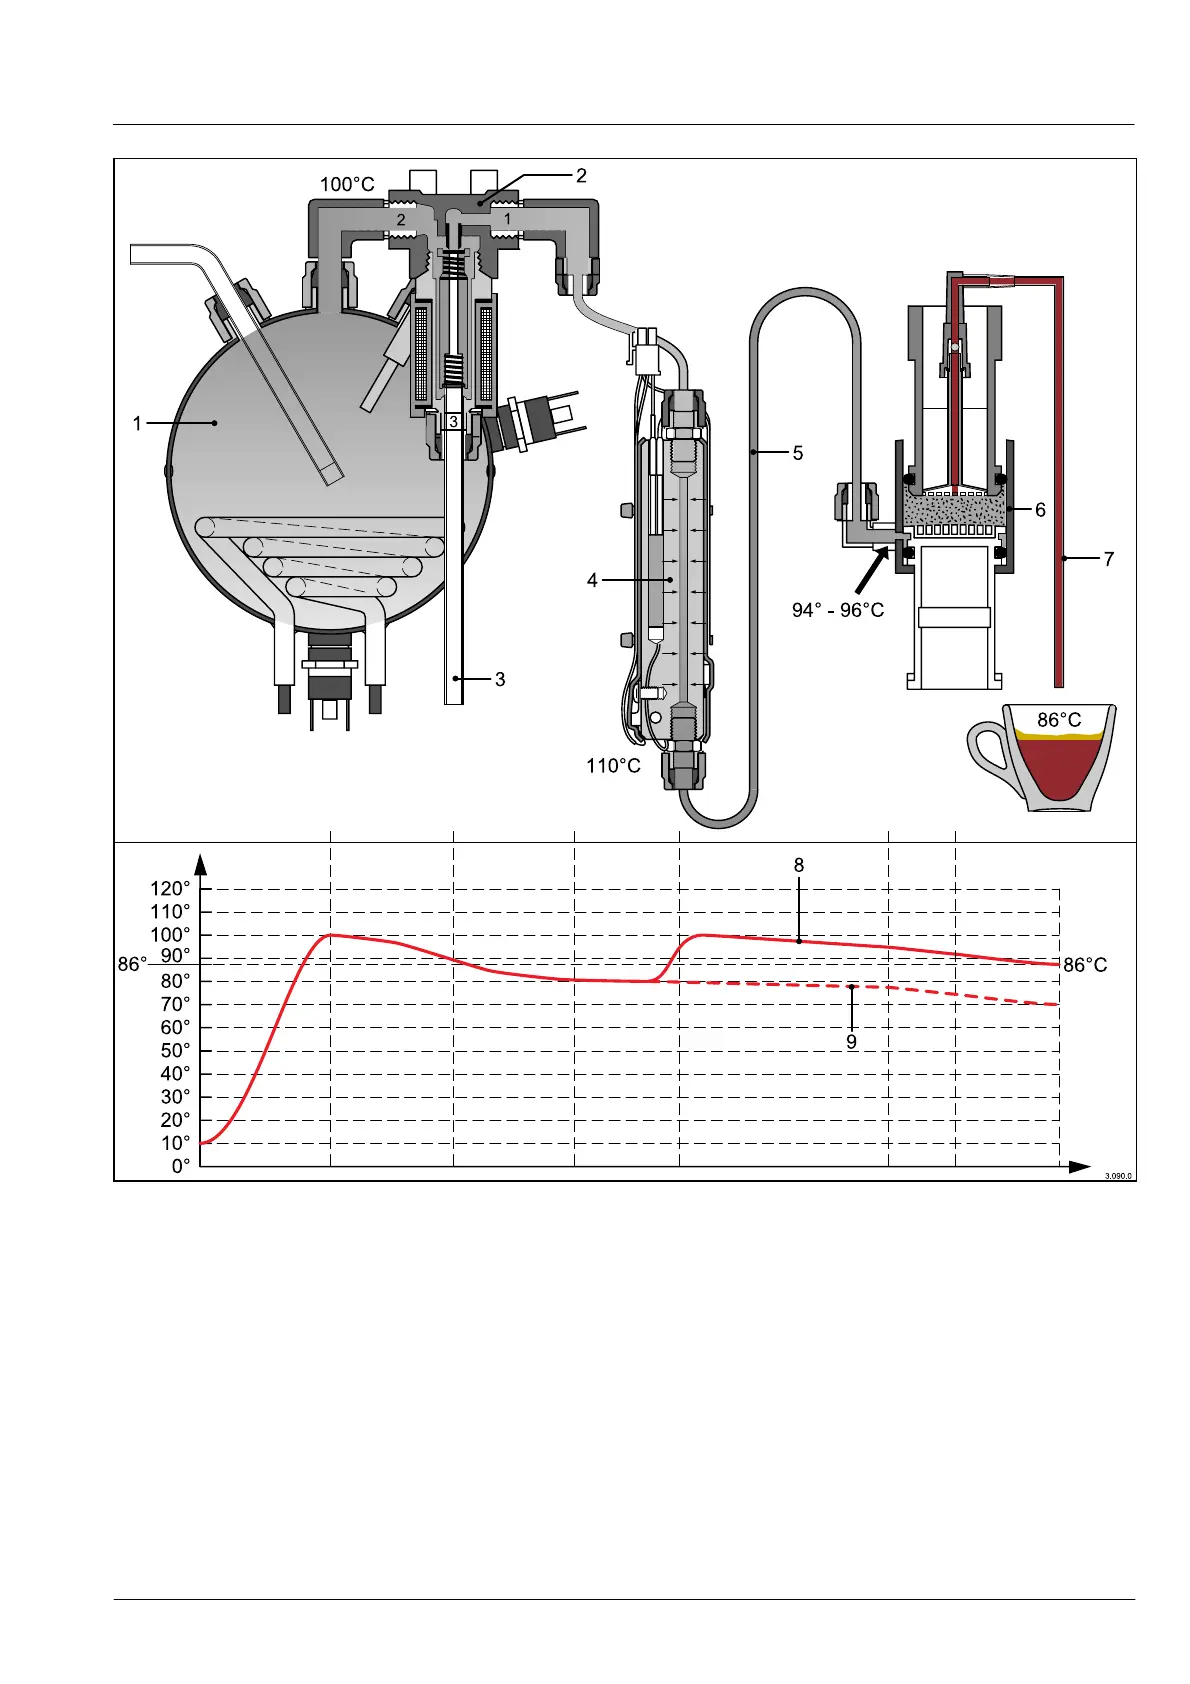
Schematic drawing of the brewing group and temperature
diagram
1 Instant heater
2 Brewing valve
3 Brew valve relief pipe
4 Booster
5 Brew pipe
6 Brew cylinder (brewing unit)
7 Outlet pipe
8 Temperature curve with booster
9 Temperature curve without booster
The temperature curve clearly shows how the booster com-
pensates for temperature loss of the brewing valve and the
brew pipe. Without this "heat push", the brewing and outlet
temperature would be approx. 15°C when the first coffee is
dispensed. The quality of the coffee would be considerably
worse because too little of the aroma material in the coffee
powder would be activated.
When a product is dispensed a second time, immediately
afterward, only a little heat is transmitted from the booster to
the coffee water. However, the system was already pre-
heated from the first product serving. The system reaches its
optimal operating temperature with further product servings
immediately afterward.