103
Chapter 4: Graphing Features
09 DrawInv DrawInv equation
Draws an inverse of a given graph expression.
Example
• Drawtheinversegraphof
y =
1
4
x
2
– 8
.
1. SelectDrawInv.
2. Enter “
1
4
x
2
–
8”on
the line.
3.Press
E
.
Note: It is also possible to
specifyafunctionequationfromY0toY9ifstored.
10 Circle( Draw a circle on the graph screen.
FromtheCalculation
screen
Circle(x-coordinate of center, y-coordinate of center,
radius)
Example
• Drawacirclewithcenterat(2,3)andofradius7.
1. SelectCircle(.
2. Enter“2,3,7)”on
the line.
3.Press
E
.
Note: Before drawing
a circle, press
Z
A
6
tosettheX-Y
coordinates to square.
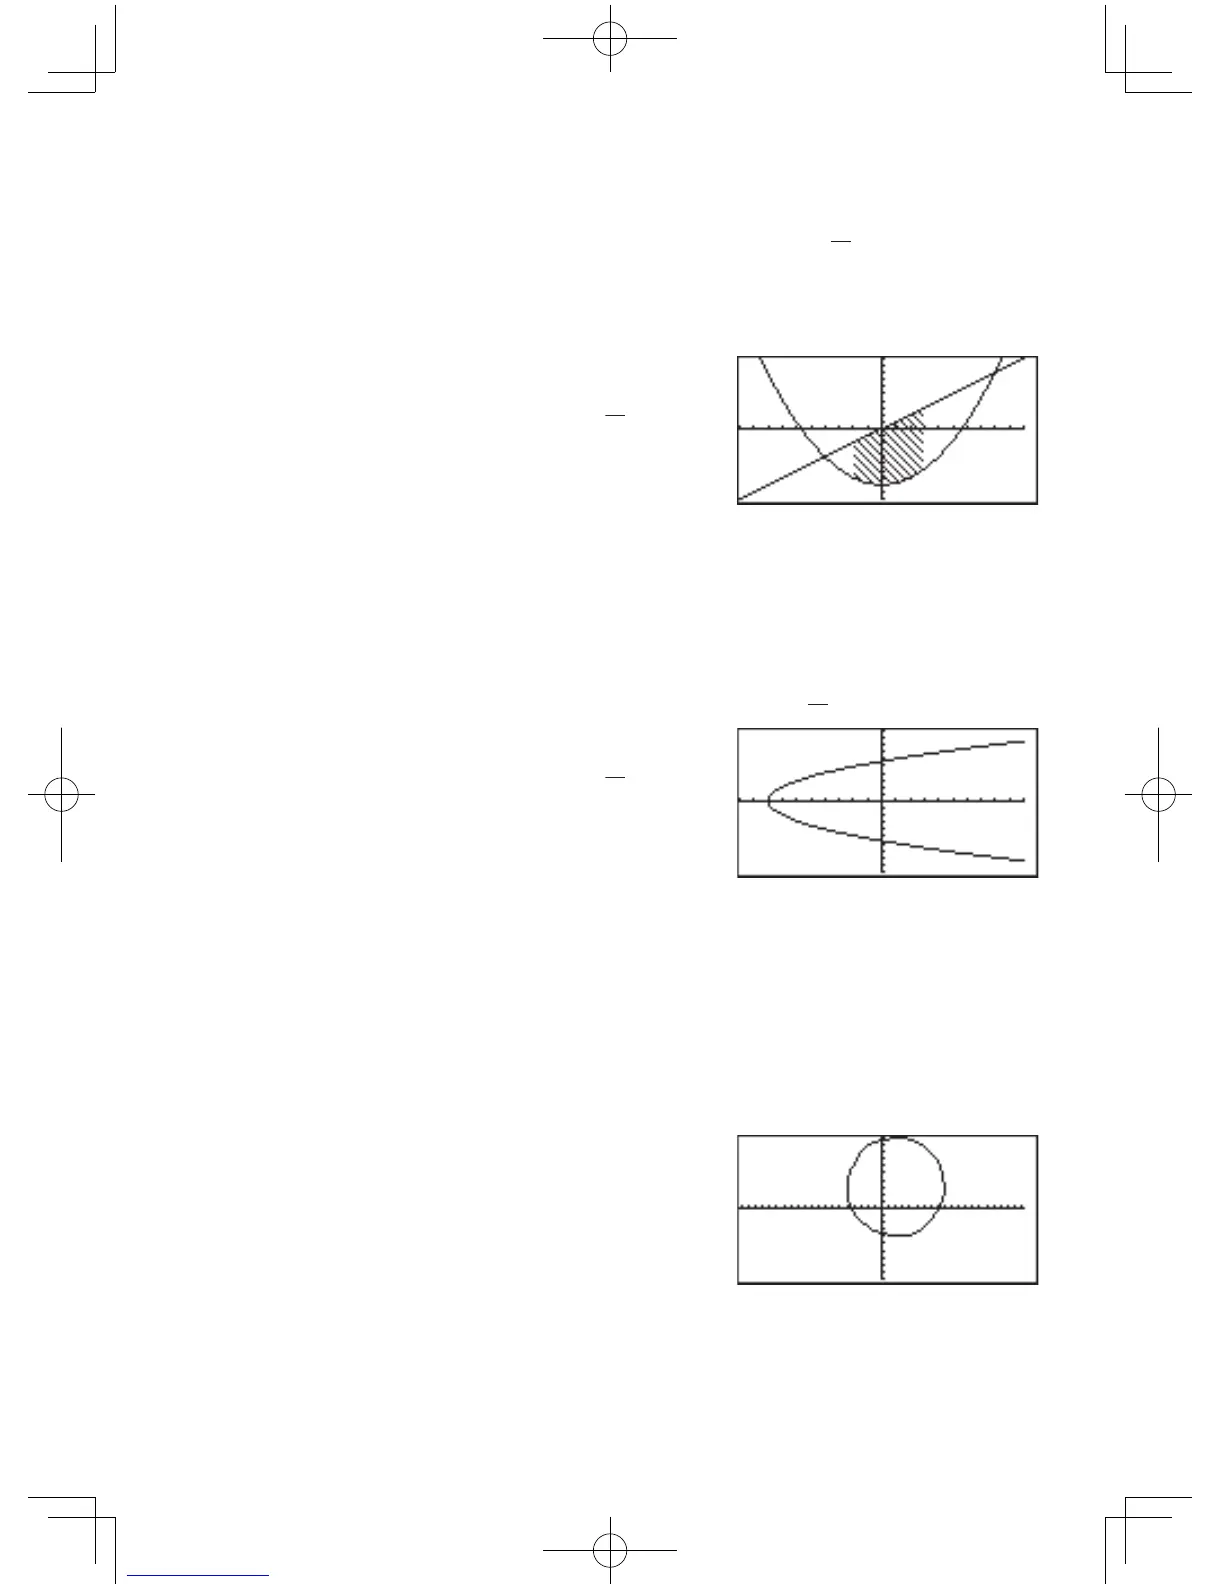
Example
• Shadetheareaenclosedby
y =
1
4
x
2
– 8
and
y = x
within the range of
–2
≤
x
≤
3
.
Beforestartingoperation,SelectClrDraw to clear the
graphs previously drawn.
1. SelectShade(.
2. Enter “
1
4
x
2
–
8, x,
-
2,3)”ontheline.
3.Press
E
.
Note: It is also possible to
specifyafunctionequationfromY0toY9ifstored.