157
Chapter 8: Statistics & Regression Calculations
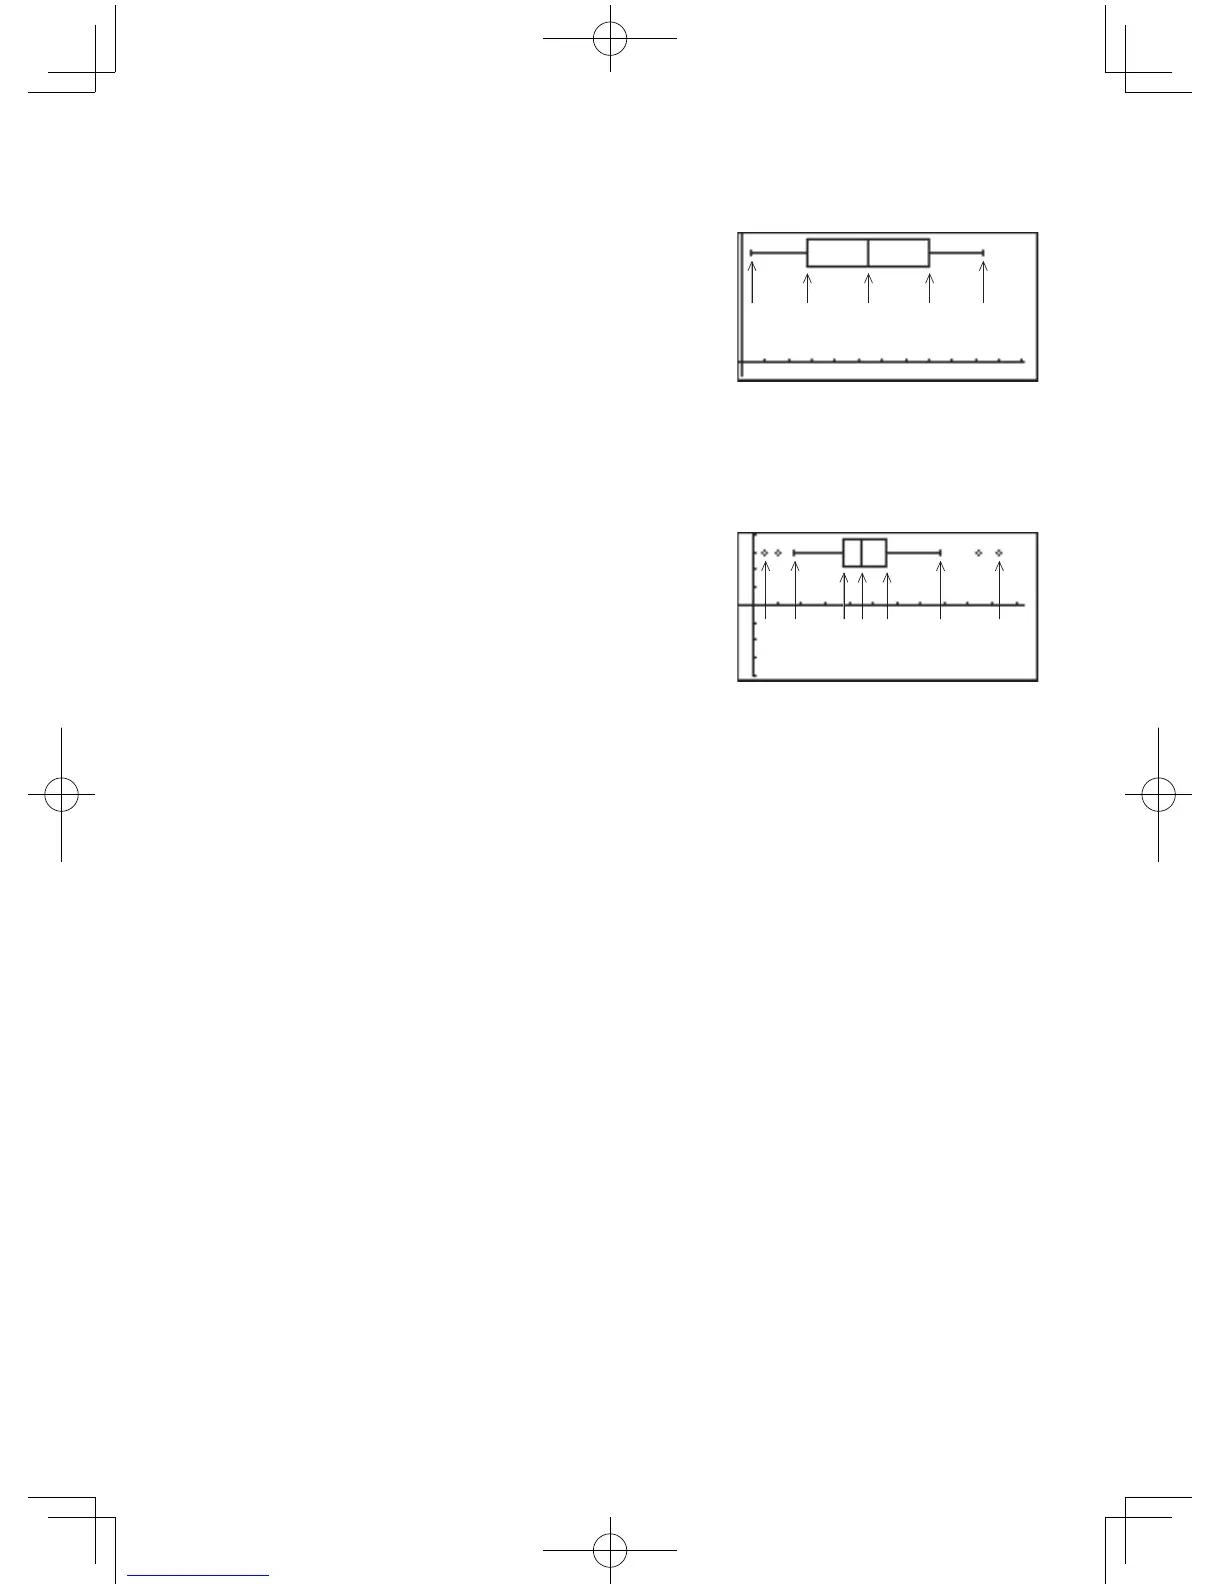
Aboxplotgraphofsample(x)
A. Theminimumvalue(xmin)of
the sample (x)
B. The first quartile (Q1)
C. Median(Med)ofthesample
(x)
D. The third quartile (Q3)
E. The maximum value (xmax) of the sample (x)
Amodiedboxplotgraphofsample(x)
A. Theminimumvalue(xmin)of
the sample (x)
B. The tip of extension which is
defined by (Q3
–
Q1) x 1.5
C. Therstquartile(Q1)
D. Median (Med) of the sample (x)
E. The third quartile (Q3)
F. Thetipofextensionwhichisdenedby(Q3
–
Q1) x 1.5
G. Themaximumvalue(xmax)ofthesample(x)
• Statisticaldataontheoutsideoftheextensionareindicatedby
points, selectable from circle, cross, or square.
• ThelengthoftheextensionfromtheboxisdeterminedbyQ1
and Q3.