158
Chapter 8: Statistics & Regression Calculations
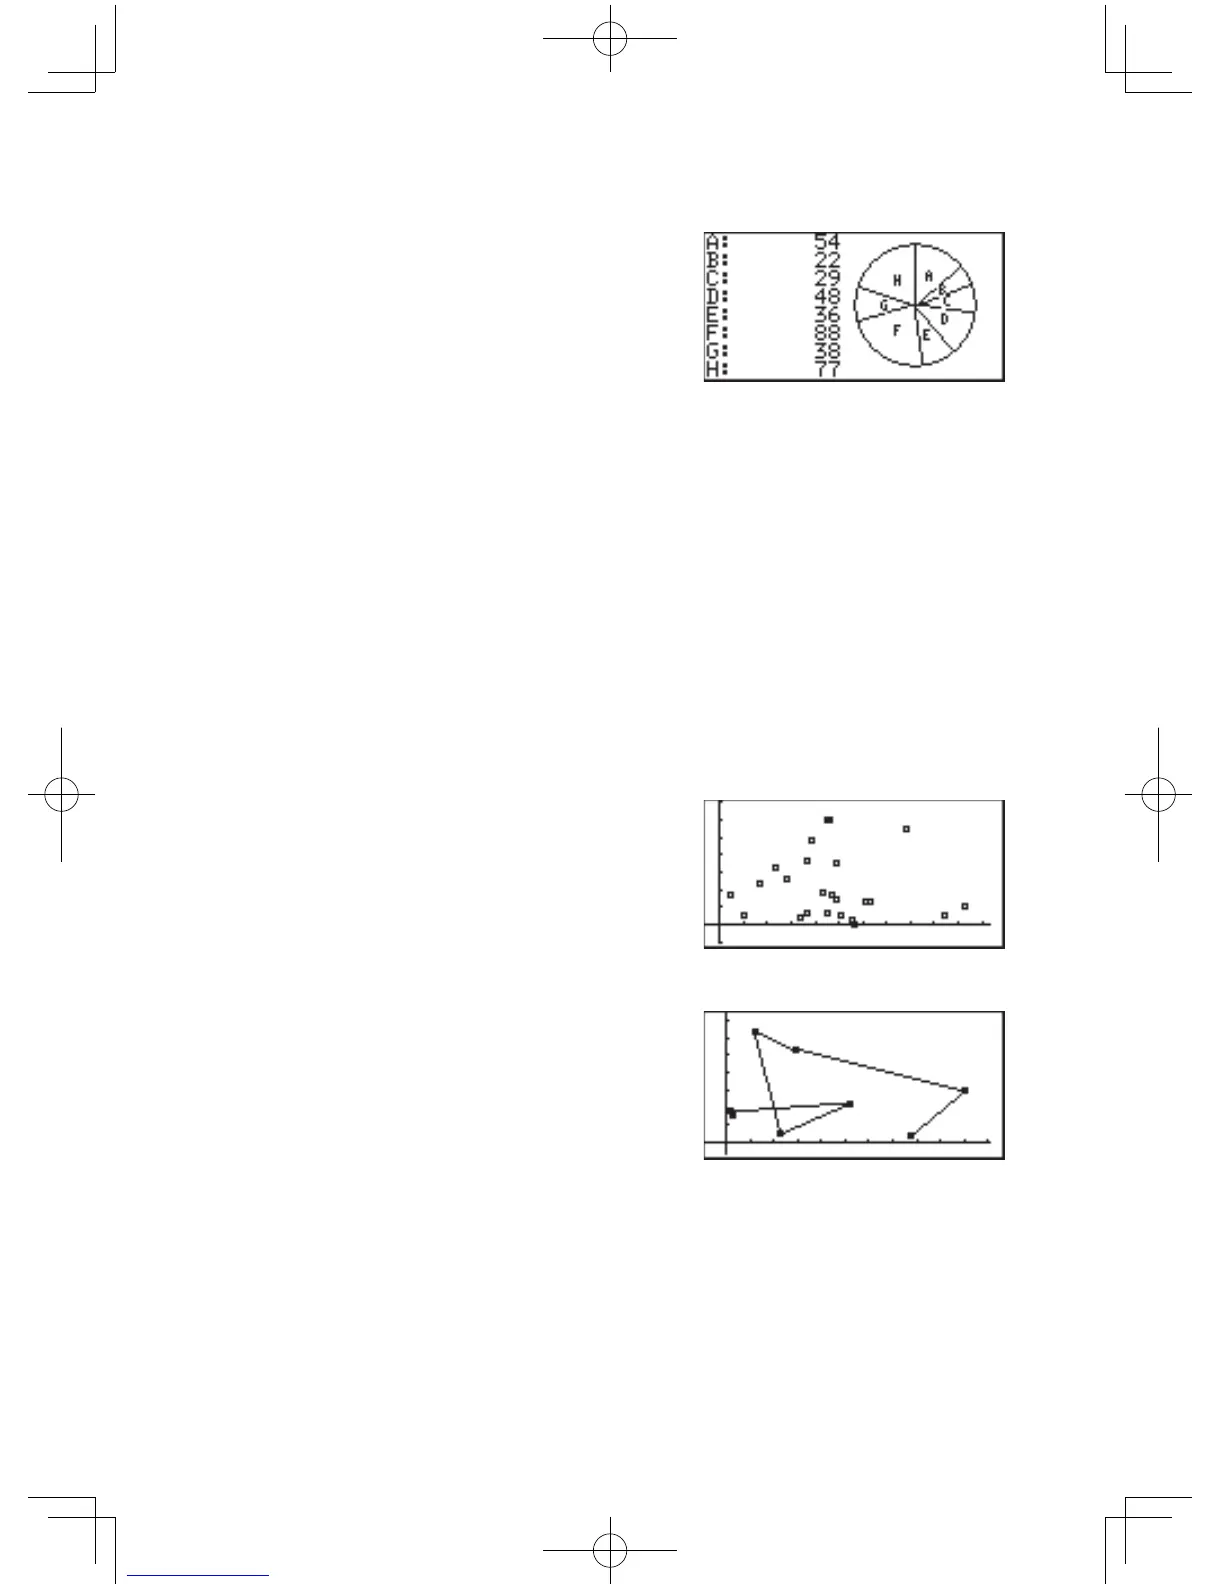
Piegraphofsample(x)
• Maximumnumberofdivisionis
8.
• Calculationrange:0
≤
x<10
100
• Datacanbedisplayedintwo
modes:
• Valuedisplay:8digits
• Percentagedisplay:Fixeddecimal(2digitsdecimal)
*Piegraphsaredrawninthesameorderasonthespecifyinglist.
*Piegraphscannotbedisplayedsimultaneouslywithothergraphs
andX/Yaxis,thoughlinesordotscanbedrawn.Thecoordinates
ofthefree-movingcursordependontheWindowsettings.
• ThevaluesarestoredinvariablesAtoH.
• Asallthedisplayedvaluesareroundeddowninthepercentage
display mode, the total percentage may not be 100.
Atwo-dimensionalplotgraphusingtwosamples(x,y)
Two sets of statistical data are required for the scatter diagram.
• Threetypesofpointsare
selectable from circle, cross
and square.
• Twostatisticaldatalistscan
besettoeitherx-ory-axis
according to your requirements.
• Displaysagraphthatconnects
each point of the scatter
diagram.
• Eachpointisconnectedin
the sequence (rows) of the
statistical data.
Pie chart
(PIE)
Scatter diagram
(S.D.)
XY Line
(XYLINE)