172
Chapter 8: Statistics & Regression Calculations
06 Tint1samp Findsthecondenceintervalforthepopulationmean
µ
.
Example
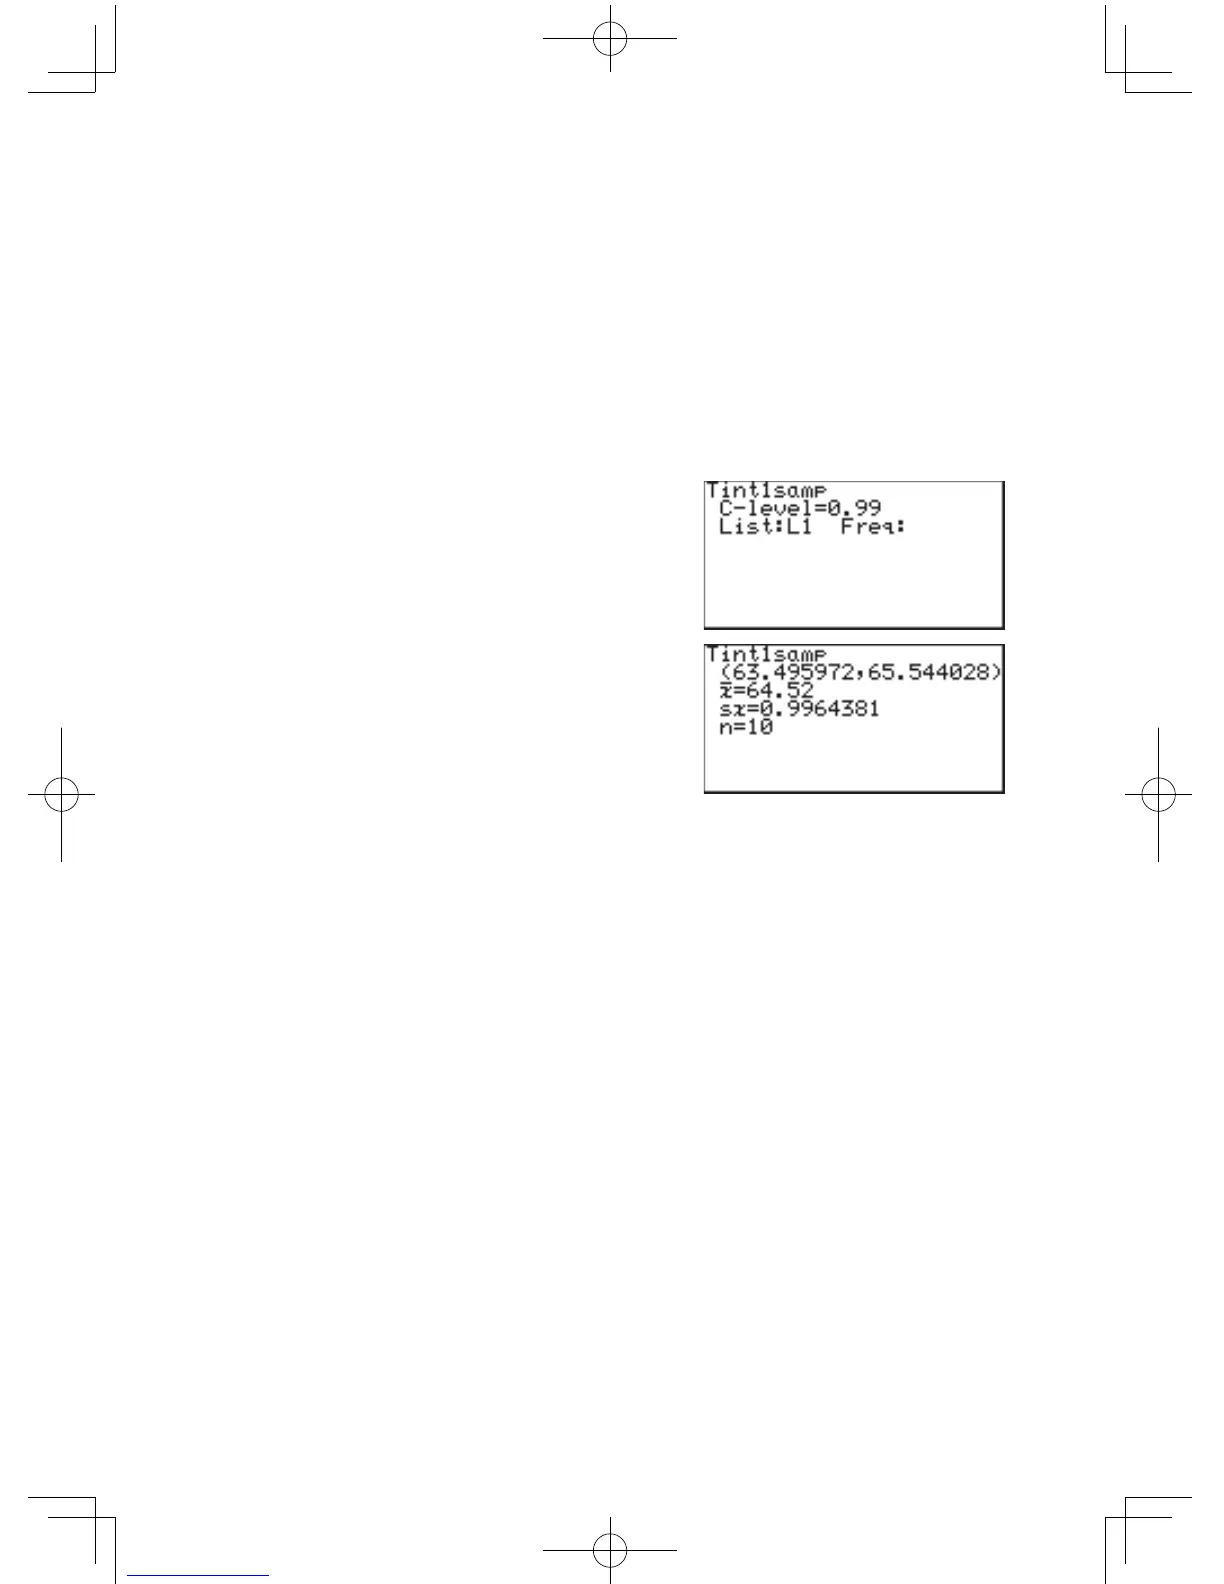
Findthecondenceintervalforthestatisticaldataof
{65.6, 62.8, 66.0, 64.5, 65.1, 65.3, 63.8, 64.2, 63.5, 64.4},
from a given population and the level of confidence is 0.99.
1. EntertheabovestatisticaldataintolistL1.
2. Press
S
E
0
6
.
The parameter input screen will appear.
3. EntertheC-levelvalueof
0.99.
4. SettheListtoL1andpress
E
.
5. Press
@
h
.
Answersaredisplayedonthe
screen, where sx indicates
the sample standard
deviation.
• Ifyouenteravaluefrom1
to100fortheC-level,itwillbechangedtothe%inputmode.
• Inthenumericalvalueinputmode,nisapositiveinteger.
07 Tint2samp Findsthecondenceintervalforthedifferenceoftwosample
means,
µ
1
and
µ
2
.
Example
Use the following two sample data (used for example 04);
List1{2.37,2.51,2.43,2.28,2.46,2.55,2.49}
List2{2.63,2.71,2.56,2.61,2.55,2.68,2.42,2.48,2.51,2.65},
with the level of confidence of 0.99.