173
Chapter 8: Statistics & Regression Calculations
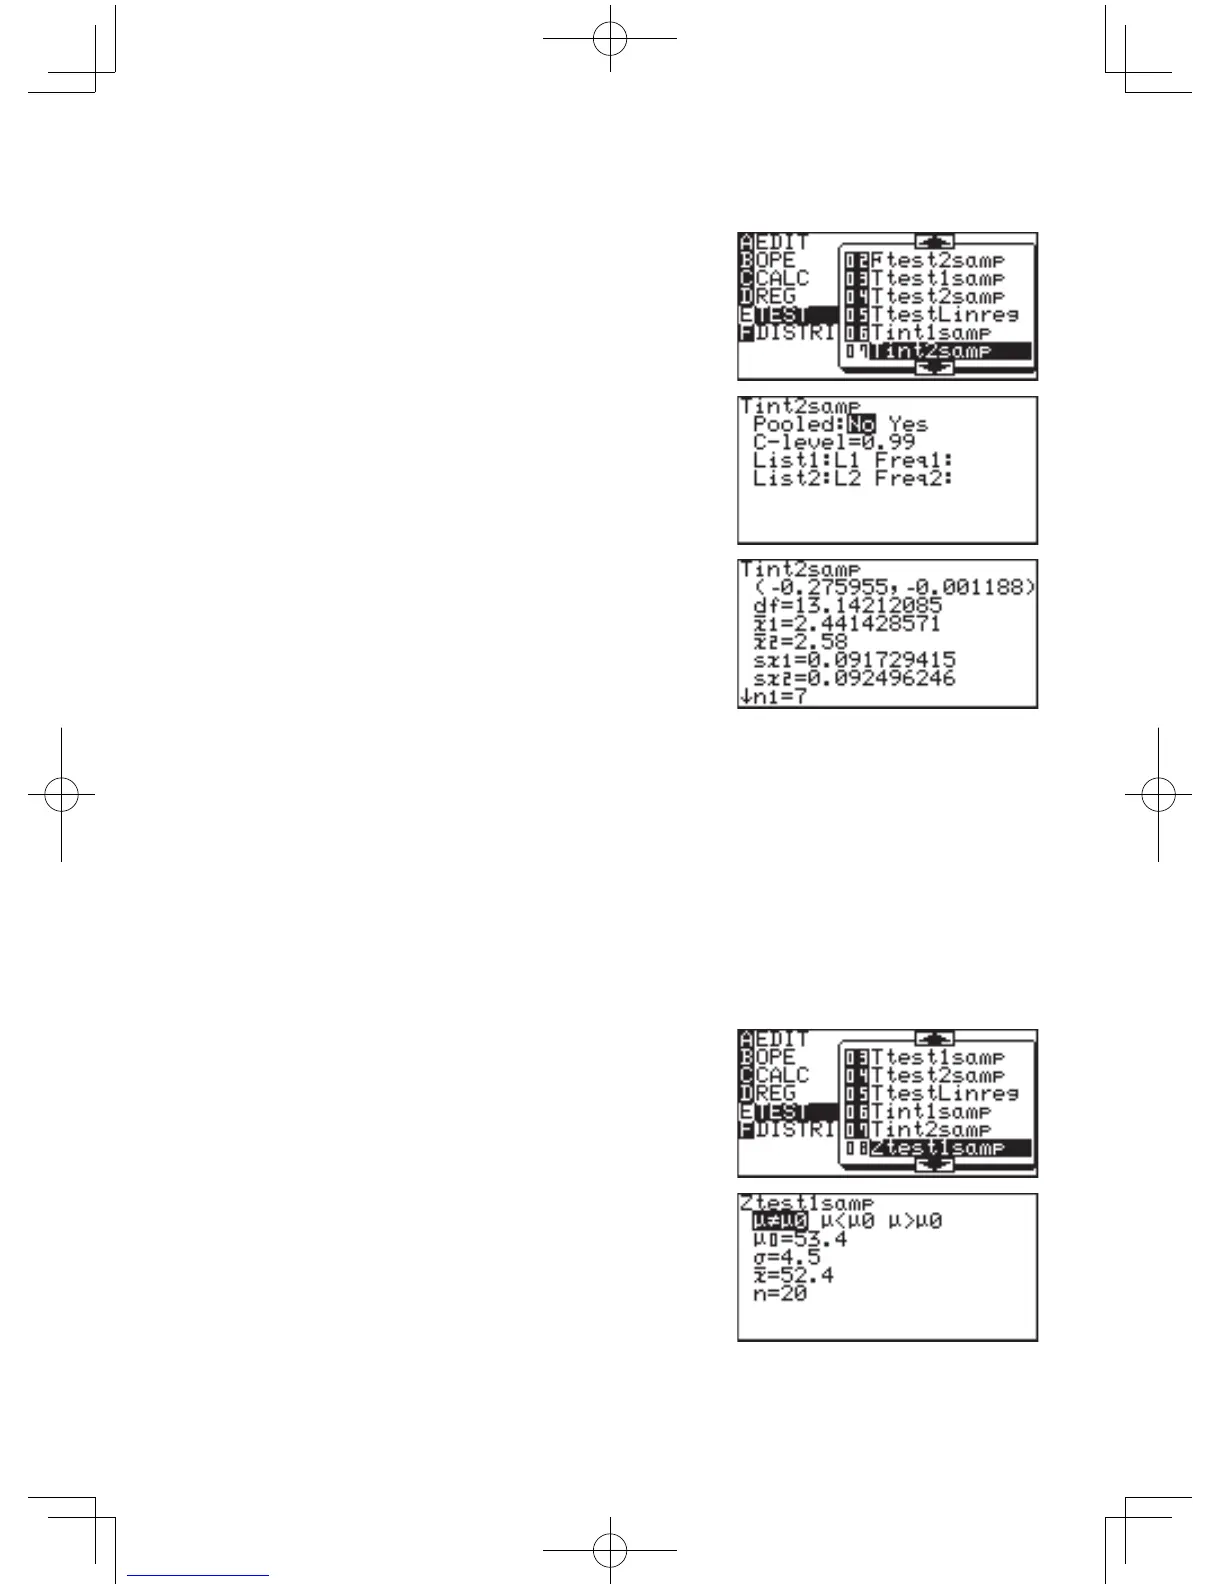
1. EntertheabovedataintolistsL1andL2.
2. Press
S
E
0
7
.
The parameter input screen
will appear.
3. Enter the appropriate value in
each field.
4. Press
@
h
.
Answersaredisplayedonthe
screen, where the numerical
value within () indicates the
confidence interval for the
differences between
µ
1
and
µ
2
when the level of confidence
is99%.
In the numerical value input
mode, “n
1
”,“n
2
”arepositiveintegers.
08 Ztest1samp Tests the hypothesis of population mean
µ
.
Example
The average weight of a newly developed product is known to be
53.4 g and standard deviation (
s
) is 4.5. Judge the validity when
the average weight of 20 units is 52.4 g (x).
Settheinputmethodtovalueinputmode
1. Press
#
S
E
1
7
E
.
2. Press
S
E
0
8
.
The parameter input screen
will appear.
3. Setthealternatehypothesis
to
µ
≠
µ
0
,
µ
<
µ
0
and
µ
>
µ
0
(two-tailtest,one-tailtest
settings). In this case, choose
µ
≠
µ
0
(two-tailtest).