Configuration using Web Based Management and Command Line Interface
4.5 The Switch menu
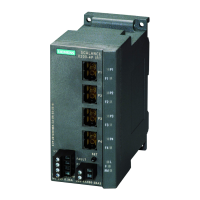
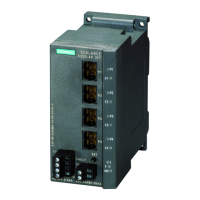
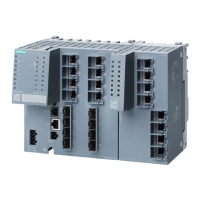
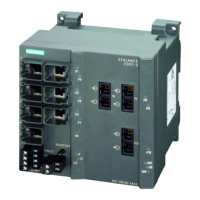
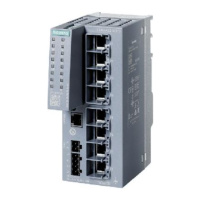
SCALANCE X-300 / X-400
Configuration Manual, 10/2014, C79000-G8976-C187-22
275
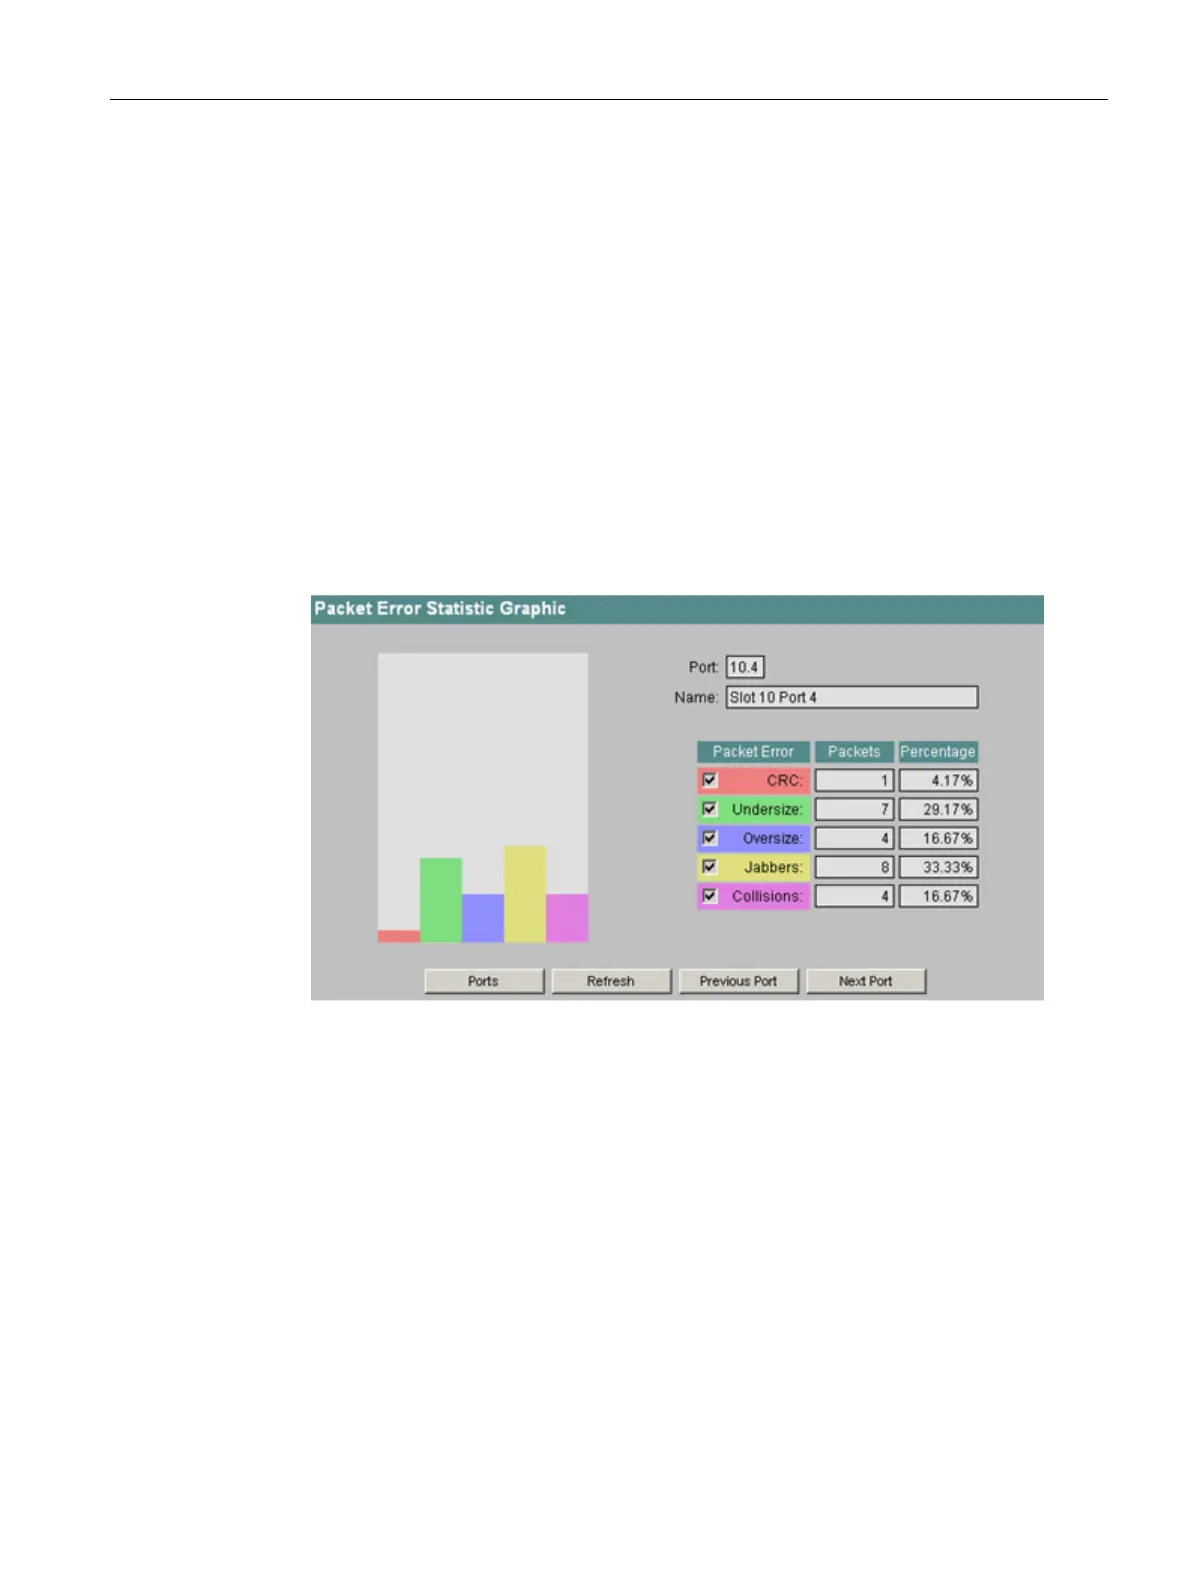
If you click on an entry in the "Port" column, the "Packet Error Statistics graphic" is displayed
for the selected port. You then see a configurable graphical representation of the counter
value.
Graphic representation of the statistics
This page displays the number of bad frames graphically. The display is dependent on the
cause of the error. There is a separate element in the graphic for each of the following
causes of error:
● CRC
● Undersize
● Oversize
● Jabbers
● Collisions
Figure 4-124 Packet Error Statistic Graphic
With the check box in the "Packet Error" column, you decide the content of the graphic. The
value in the "Packets" column in the graphic is only displayed for a certain frame type if the
appropriate check box is selected. The "Percentage" column shows the errors of a certain
type as a percentage of the total errors for this port. When the percentage is calculated, error
types are included only if their check boxes are selected.
With the "Previous Port" and "Next Port" buttons, you can change to the display of the
previous or next port.
 Loading...