Configuring with Web Based Management
6.6 "Interfaces" menu
SCALANCE W780/W740 to IEEE 802.11n Web Based Management
Configuration Manual, 08/2018, C79000-G8976-C267-13
319
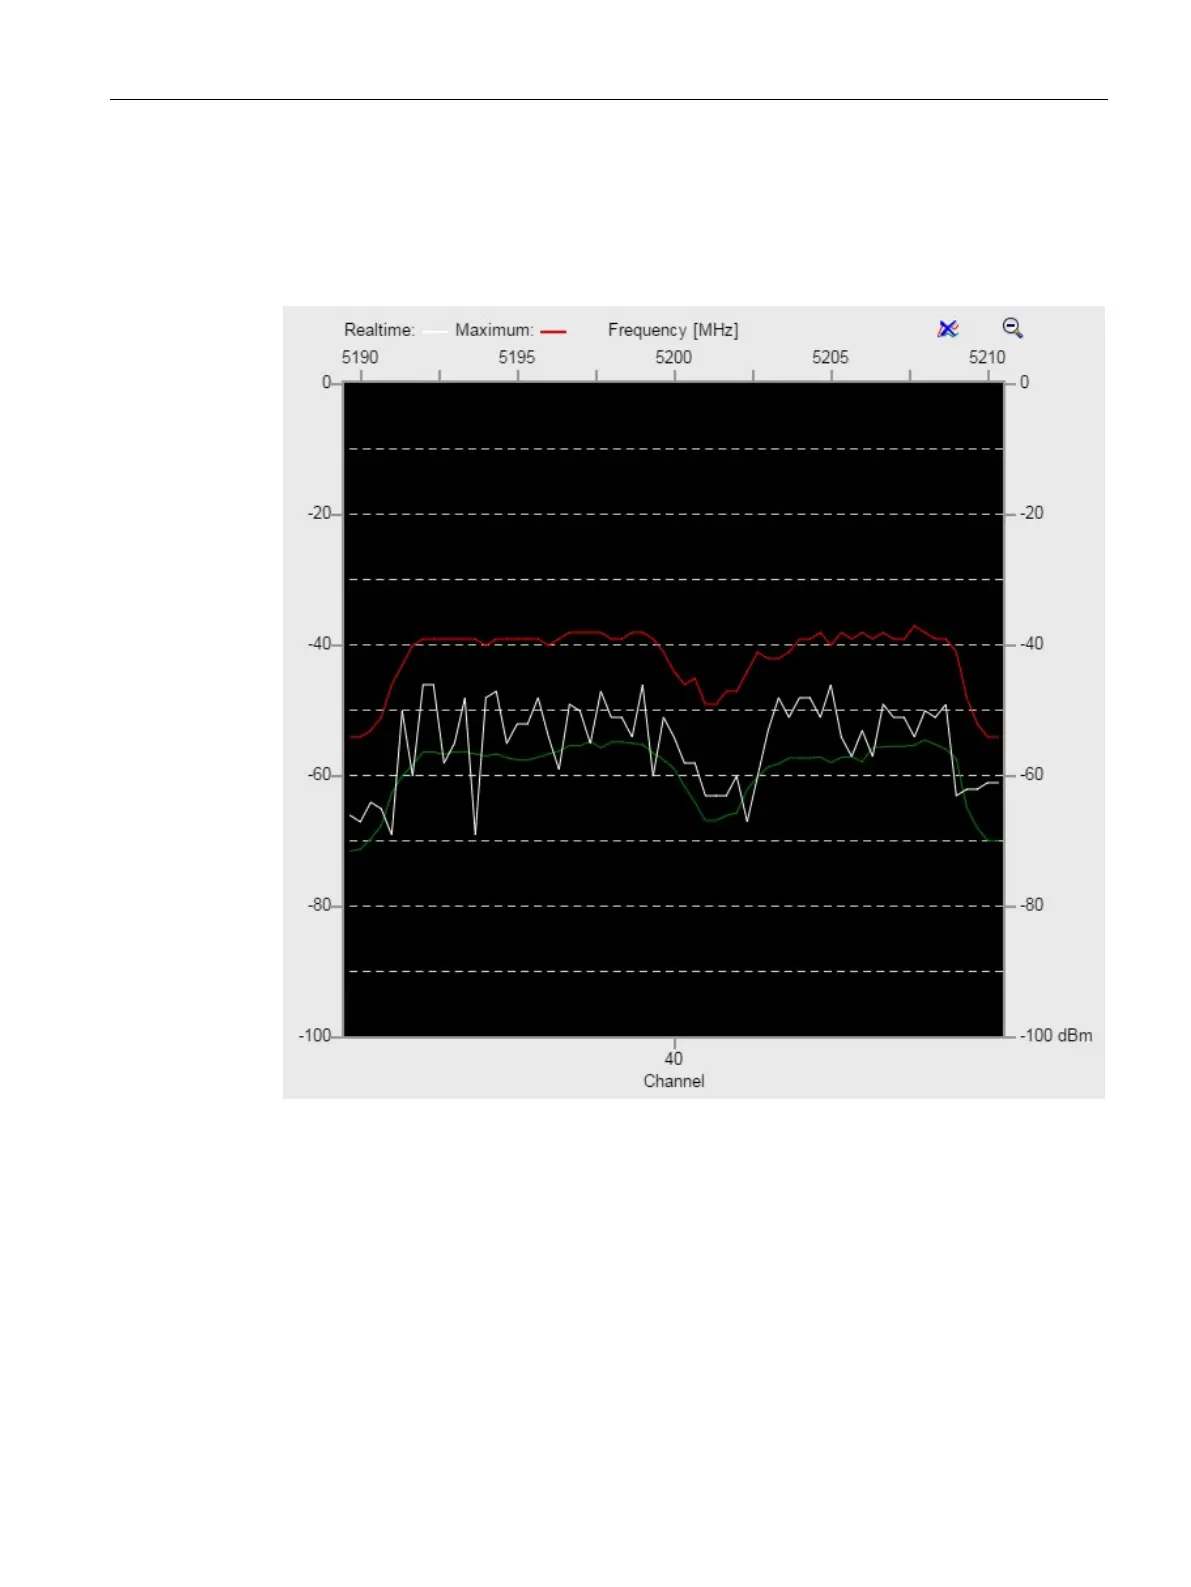
In all graphics, the lower x axis shows the channels around the selected center frequency for
which the measurements are made. The upper x axis shows the frequency range. The
display of the y axis depends on the selected graphic.
● Realtime
The y axis shows the signal strength in dBm.
The graphic shows the strength of all signals that the access point receives in its
environment in the configured frequency range.
The red line shows the maximum values since the start of the measurement. The white
line shows the current values. The green line shows the average values.
● Spectrogram
 Loading...