7.9.3 Bar chart
Note
Functions for the display of process variables and measured values are available in SIMATIC
PDM, if they are provided by the manufacturer of the device description.
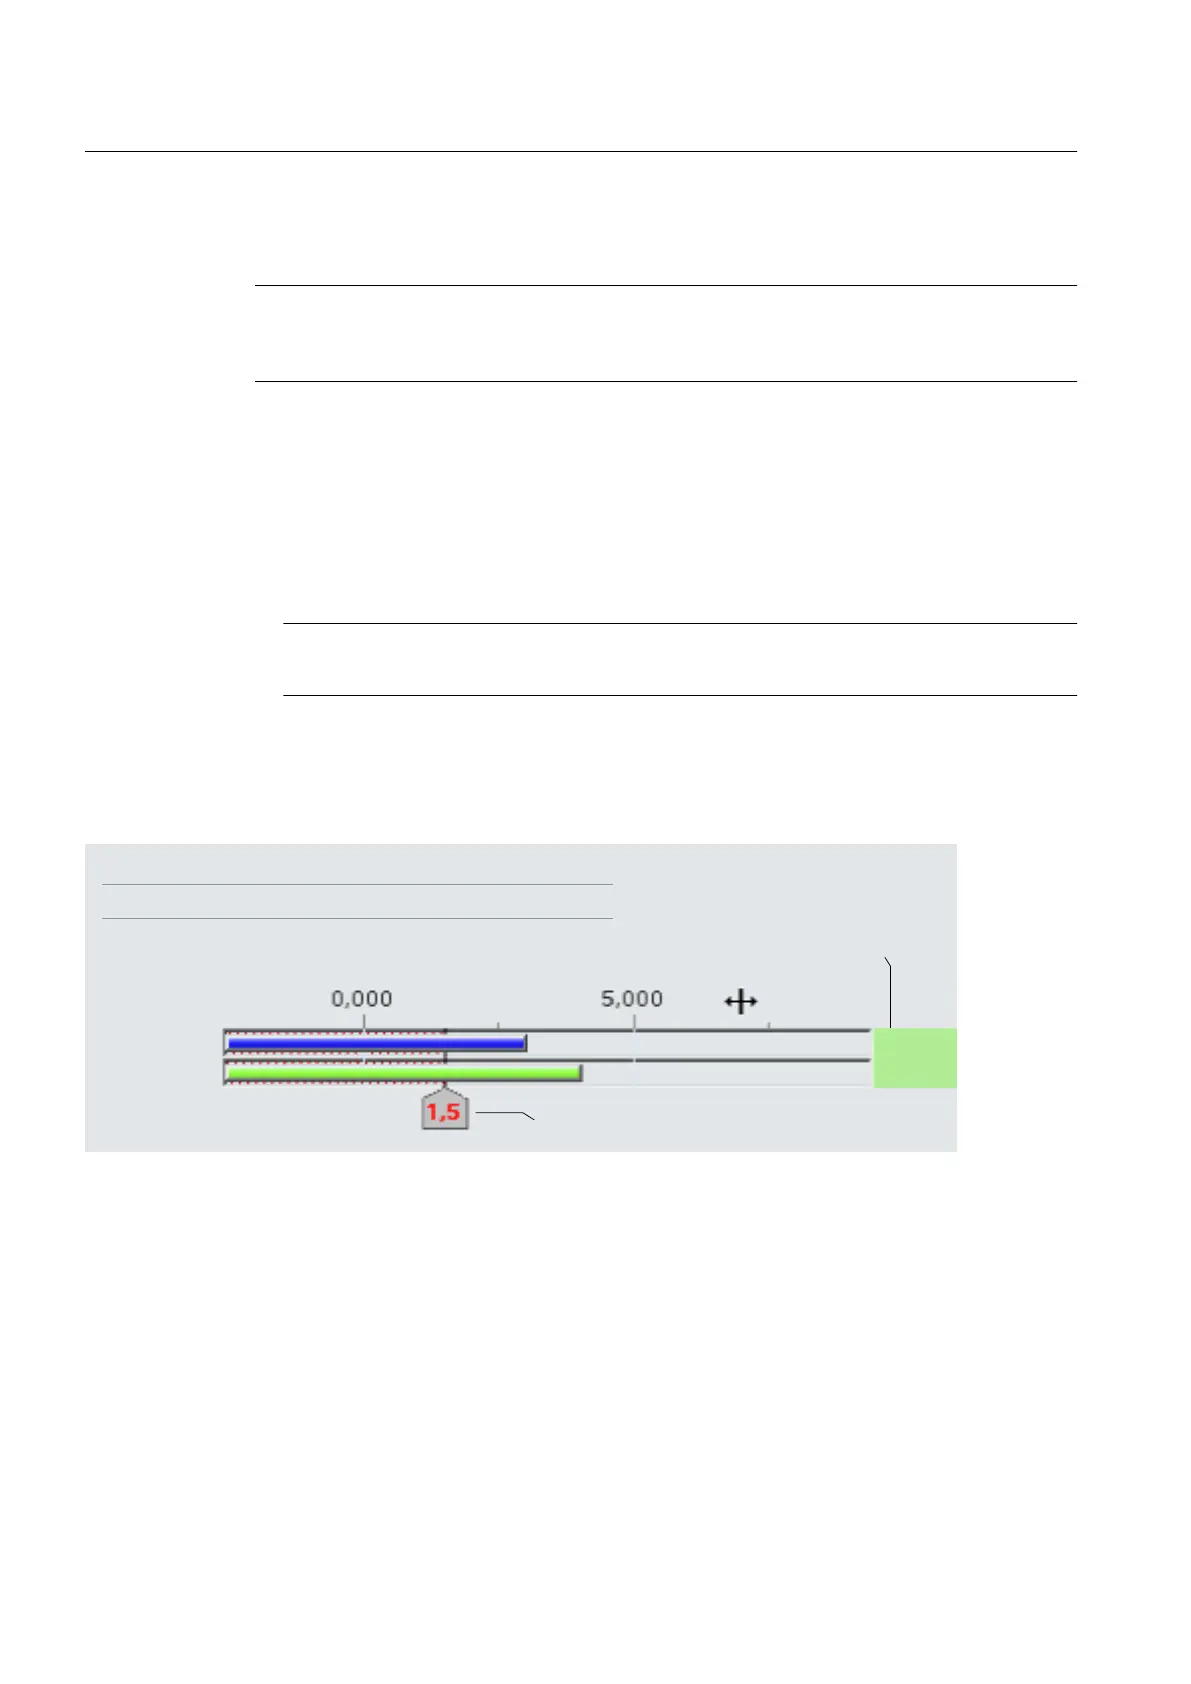
Process variables and measured values are displayed in bar charts. A bar chart always shows
current values.
The following may be displayed in the bar charts:
● Name of the chart
● Names of the variables
● Limit (for the warning range)
Note
The value range of the axis can be moved with the mouse.
Example
The figure below shows an example of a dialog window with a bar chart.
7$*
3ODQWGHVLJQDWLRQ
3DUDPHWHU
3DUDPHWHU
'HVFULSWLRQ
&XUUHQWYDOXH
/LPLW
Additional information
● Section "Trend chart (Page 142)"
● Section "Tachometer chart (Page 145)"
● Section "Icons and buttons (Page 146)"
● Section "Work with trends (Page 147)"
● Section "Editing trends (Page 149)"
Functions
7.9 Graphical displays
Help for SIMATIC PDM (V8.2)
144 Operating Manual, 02/2014, A5E33203676-AA