QA BEAMCHECKER™ PLUS 45
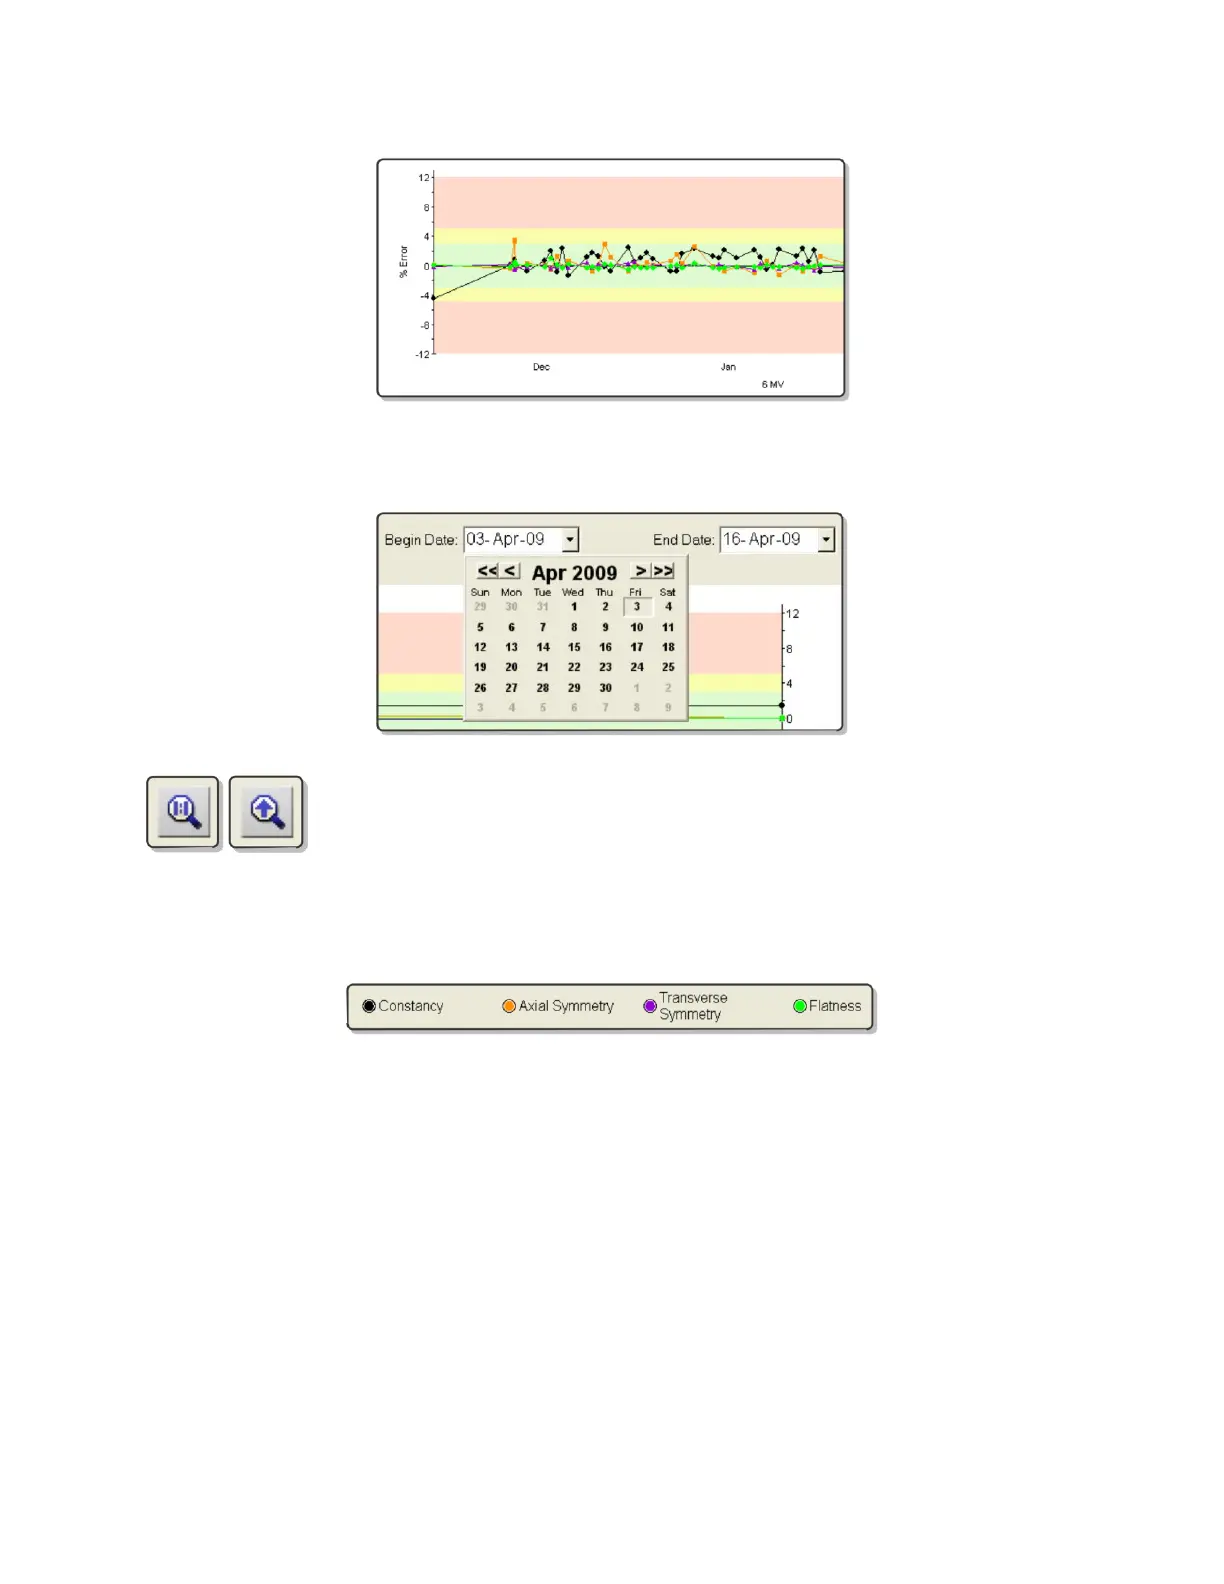
Select the Begin Date, End Date, and click the Update Chart button. The Chart View will
update to reflect the specified range.
Click and drag horizontally within the Chart View, to zoom to a selection
range. To return to the top-level zoom, click the 1:1 zoom button. If multiple
sequential drag selections are made, they can be reverted one at a time by
clicking the up arrow zoom button.
The components of the Chart View (constancy, axial symmetry, output measurement, etc) can
be toggled on or off by clicking the component name shown below the Chart View.
The constancy results for the static mode can be viewed with the vertical axis label as a relative
dose by de-selecting all of the other parameters on the graph.

 Loading...