QA BEAMCHECKER™ PLUS 46
Using the Table View
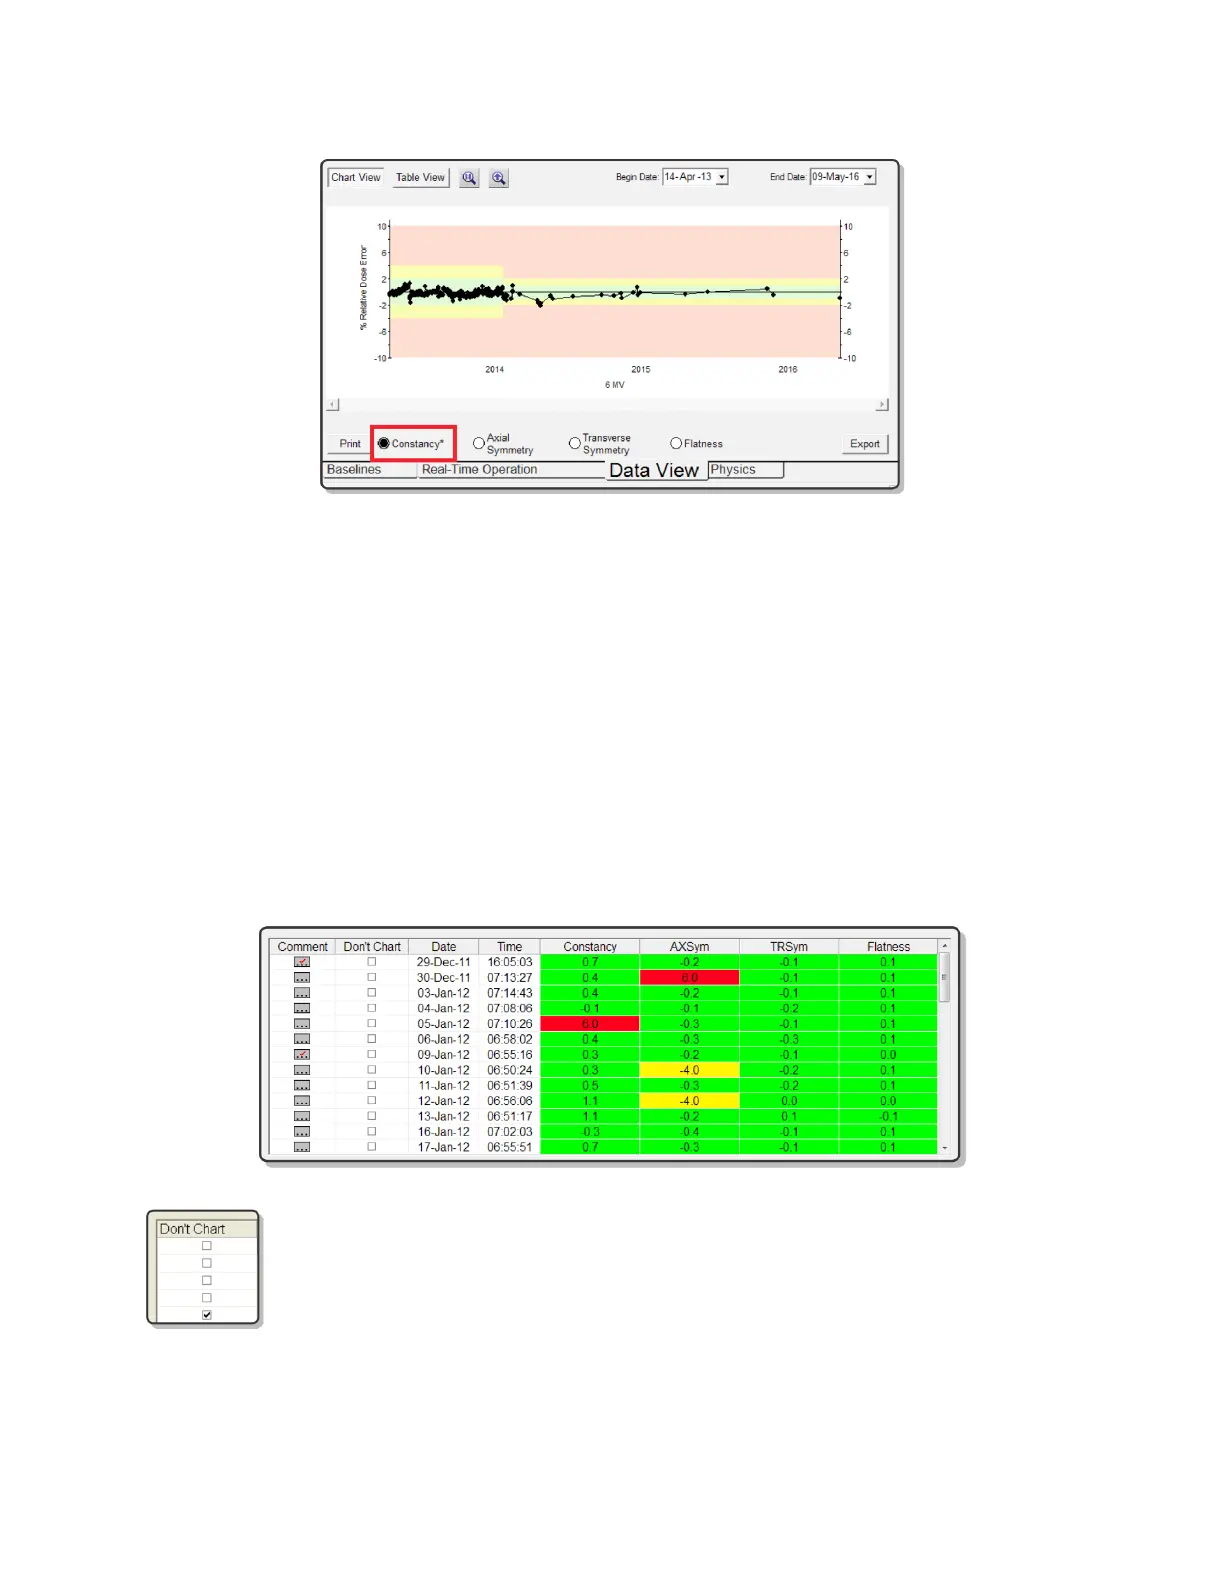
To view the data in tabular format, click the Table View button. Each row represents a unique
measurement point and includes the date and time of measurement along with percentage
differences from the baseline.
The colors shown on the table indicate how close the acquired values are to the baseline. Just
like the status indicators found in the Real-Time Operation mode, the colors of the cells are
defined as follows:
Green Below action level 1
Yellow At or above action level 1, but below action level 2
Red At or above action level 2
Checking a box in the Don't Chart column will hide that data point in the Chart
View. This is useful to hide a mistaken or erratic data point from the Chart View.