Working in the Graph View 29
2. Type the name of the title in the Title field.
—or—
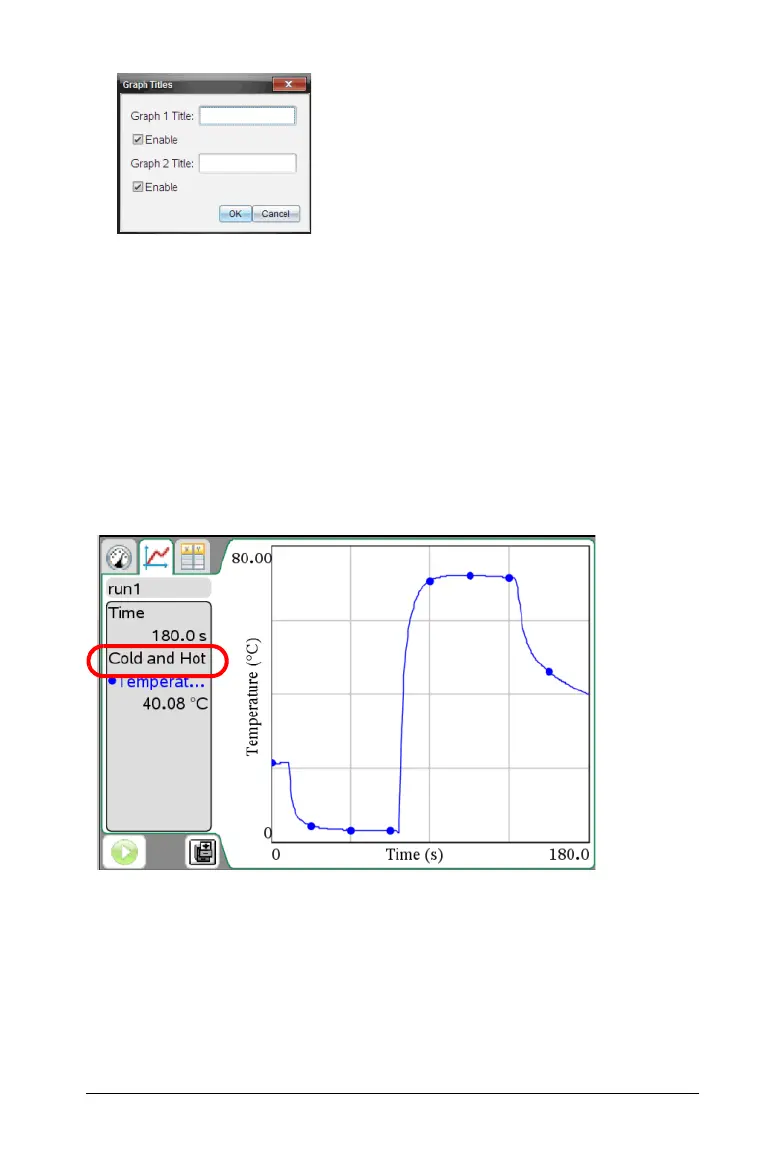
a) Type the name of the first graph in the Graph 1 field.
b) Type the name of the second graph in the Graph 2 field.
3. Select
Enable to show the title.
Note: Use the Enable option to hide or show the graph title as
needed.
4. Click OK.
The title is shown.
Setting Axis Ranges for One Graph
To modify the minimum and maximum range for the x and y axis:
1. Click
Graph > Window Setting.
The Window Setting dialog box opens.

 Loading...


