30 Working in the Graph View
2. Type the new values in one or more of these fields:
–X Min
–X Max
–Y Min
–Y Max
3. Click OK.
The application uses the new values for the graph visual range until
you modify the range or change data sets.
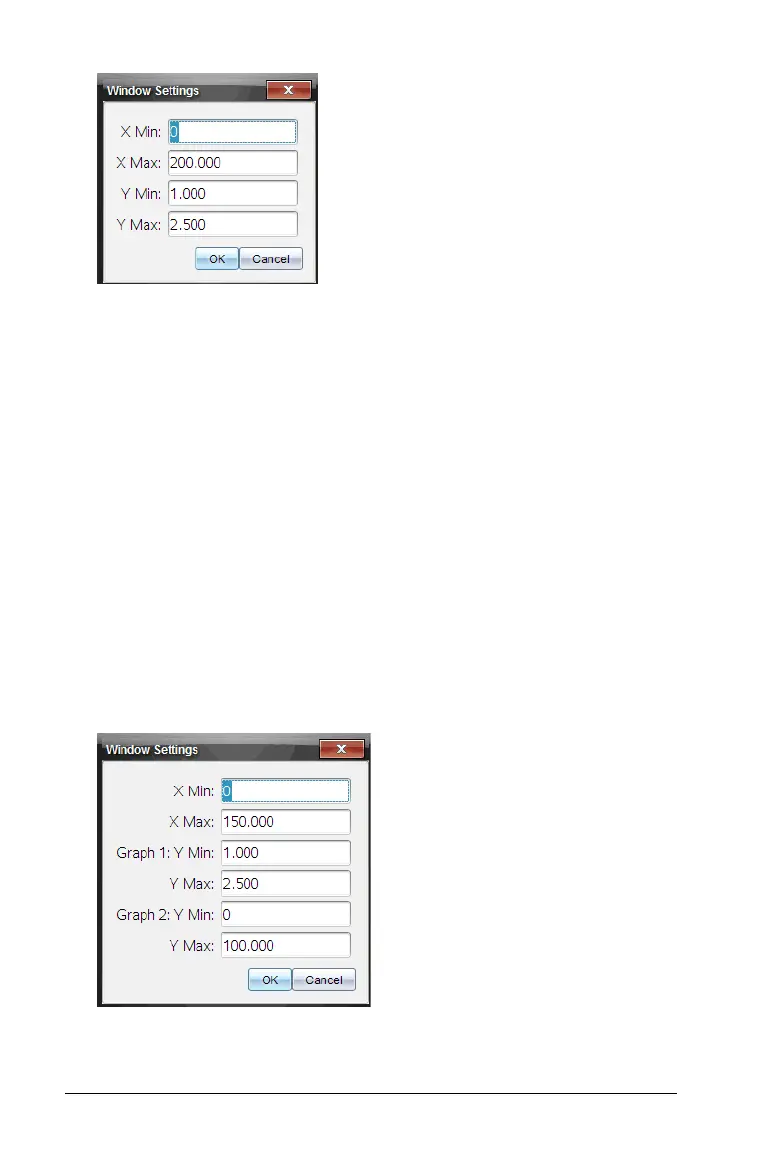
Setting Axis Ranges for Two Graphs
When working with two graphs, enter two y axis minimum and
maximum values, but only one set of minimum and maximum values for
the x axis.
1. Click
Graph > Window Setting.
The Window Setting dialog box opens.
2. Type the new values in one or more of these fields:
–X Min

 Loading...


