EasyManuals Logo

Texas Instruments TI-Nspire Guide Book

Texas Instruments TI-Nspire
112 pages
To Next Page IconTo Next Page
To Previous Page IconTo Previous Page
Page #35 background imageLoading...
Page #35 background image
Working in the Graph View 31
–X Max
–Graph 1: Y Min
–Y Max
–Graph 2: Y Min
–Y Max
3. Click OK.
The application uses the new values for the graph visual range until
you modify the range or change data sets.
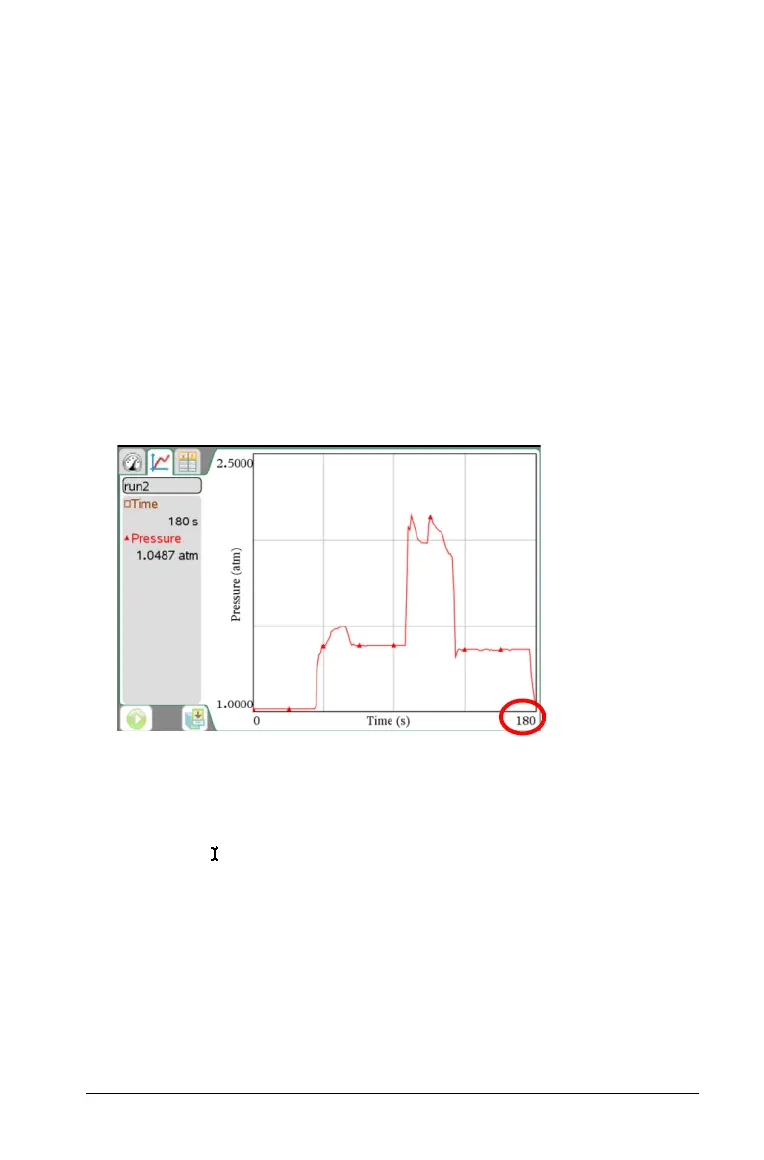
Setting the Axis Range on the Graph
You can modify the minimum and maximum range for the x and y axis on
the graph.
1. Select the text you want to change.
2. Type a new value for the text.
Handheld:
a) Place the cursor over the value until the cursor changes to an
I-beam .
b) Highlight the text you want to change.
c) Type a new value for the text.
d) Press
·.
The text is changed, and the graph redrawn to reflect the change in
value.

Table of Contents

Other manuals for Texas Instruments TI-Nspire

Questions and Answers:

Question and Answer IconNeed help?

Do you have a question about the Texas Instruments TI-Nspire and is the answer not in the manual?

Texas Instruments TI-Nspire Specifications

General IconGeneral
TypeDisplay
Form factorPocket
Product colorBlue, White
Display resolution320 x 240 pixels
Display size (HxV) (imperial)0 \
Compatible operating systemsWindows Vista/XP Mac OS X 10.4/10.5
Battery typeAAA
Number of batteries supported4
Weight and Dimensions IconWeight and Dimensions
Dimensions (WxDxH)100 x 198.3 x 28.7 mm

Related product manuals