32 Working in the Graph View
Selecting a Data Set to Plot
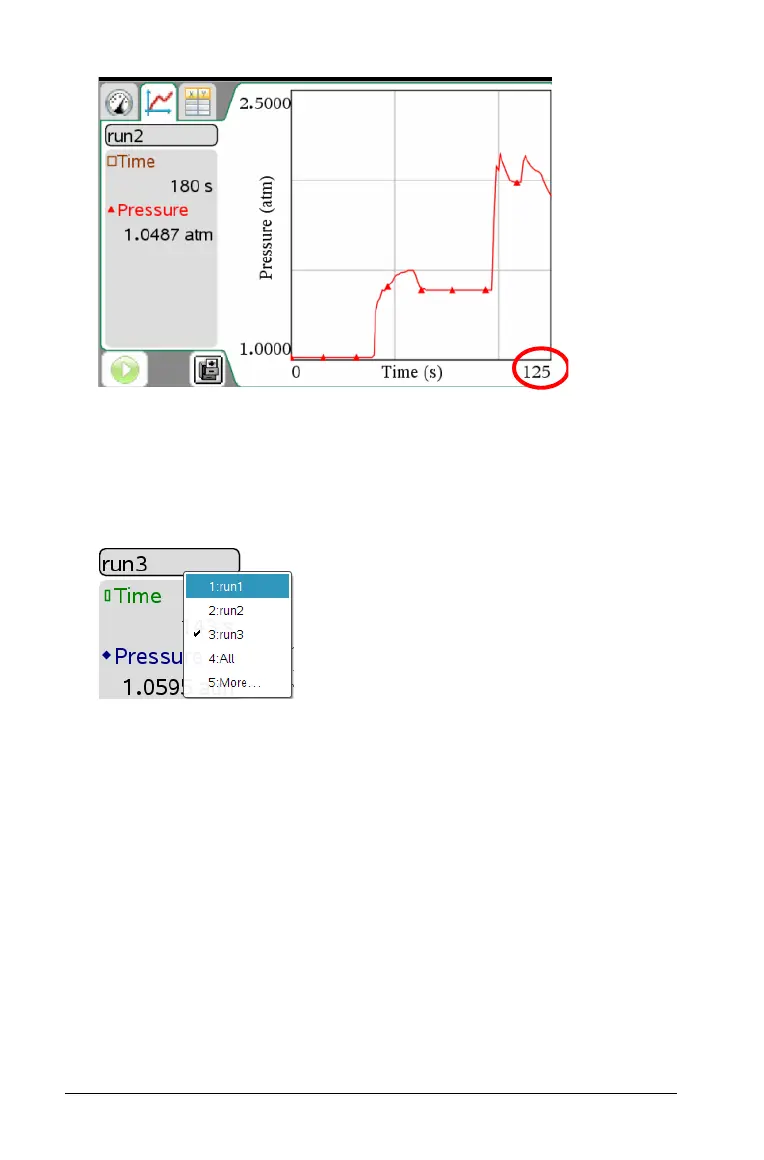
To save data sets or run multiple trials, select the data set to plot.
1. Click
Graph > Select Data Set.
The list of available data sets opens.
2. Select one of the following:
• Data Set name. Plot one specific data set.
• All. Plot all data sets.
•
More. Choose a combination of data sets to plot.
When you use the More option and select more than one data set
but not all data sets, the Data Set selection tool states Custom.
3. Click OK.
The data set you selected is displayed.

 Loading...


