Working in the Graph View 33
Autoscaling a Graph
Use the autoscale option to show all the points plotted. Autoscale Now is
useful after you change the x and y axis range or zoom in or out of a
graph. You can also define the automatic autoscale setting to use during
and after a collection.
Autoscale Now Using the Application Menu
Click Graph > Autoscale Now.
The graph now displays all the points plotted.
Autoscale Now Using the Context Menu
1. Open the context menu in the graph area.
2. Click Window/Zoom > Autoscale Now.
The graph now displays all the points plotted.
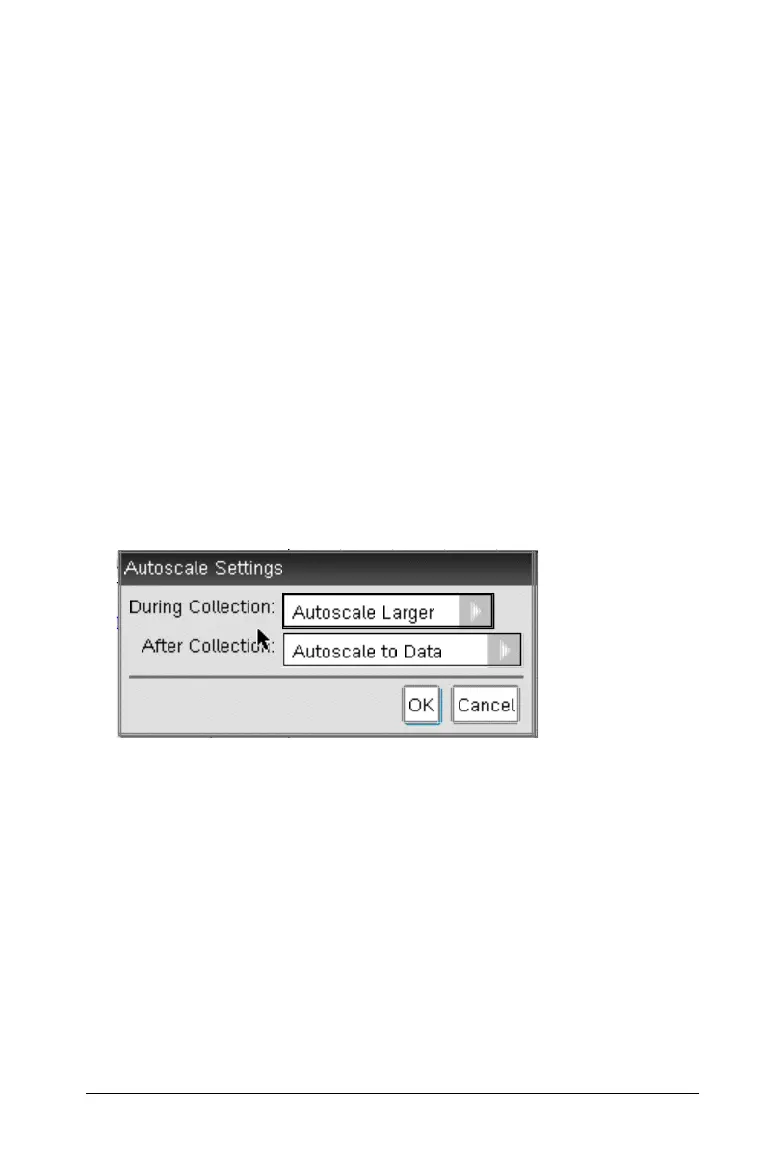
Defining Autoscale During a Collection
There are two options for using the automatic autoscaling that occurs
during a collection. To choose an option:
1. Click
Options > Autoscale Settings.
The Autoscale Settings dialog box opens.
2. Click
¢ to open the During Collection drop-down list.
3. Select one of these options:
•
Autoscale Larger - Expands the graph as needed to show all
points as you collect them.
• Do Not Autoscale - The graph is not changed during a collection.
4. Click
OK to save the setting.
Defining Autoscale After a Collection
You have three options for setting the automatic autoscaling that occurs
after a collection. To set your choice:

 Loading...


