34 Working in the Graph View
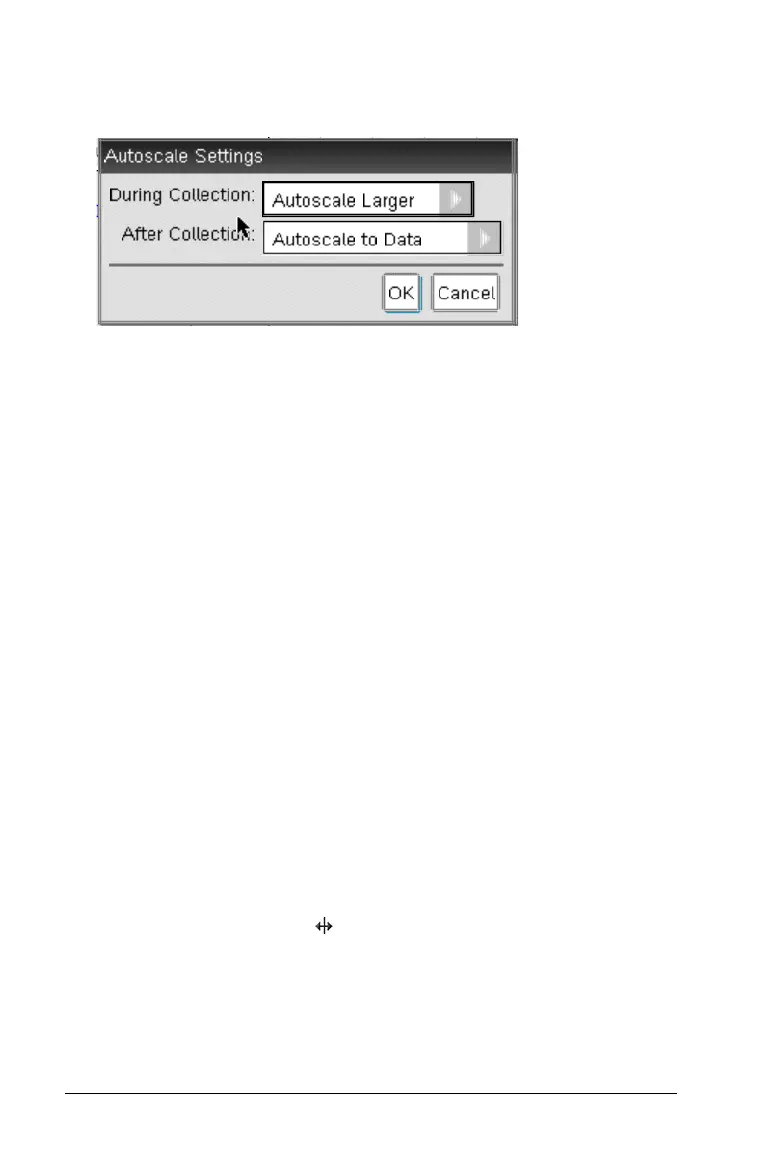
1. Click Options > Autoscale Settings.
The Autoscale Settings dialog box opens.
2. Click ¢ to open the After Collection drop-down list.
3. Select one of these options:
•
Autoscale to Data. Expands the graph to show all data points.
This option is the default mode.
• Autoscale From Zero. Modifies the graph so all data points
including the origin point are displayed.
• Do Not Autoscale. The graph settings are not changed.
4. Click OK to save the setting.
Selecting a Range of Data
Selecting a range of data on the graph is useful in several situations, such
as when zooming in or out, striking and unstriking data, and examining
settings.
To select a range:
1. Place the cursor at the start of the area.
2. Drag the cursor across the graph to the end of the selected region.
The selected area is indicated by gray shading.
Handheld:
a) Place the cursor at the starting point, and then press
/ x.
The cursor changes to (double-headed arrow).
b) Move the cursor to the end of the selection.
c) Press
d.
The cursor changes to
å (single-headed arrow).

 Loading...


