Working in the Graph View 35
3. Perform one of these actions.
– Zoom in or out
– Strike or unstrike data
– Examine settings
Zooming In on a Graph
You can zoom in on a subset of the collected points. You can also zoom
out from a previous zoom or to expand the graph window beyond the
data points collected.
To zoom in on a graph:
1. Select the area you want to zoom into or use the current view.
2. Click Graph > Zoom In.
The graph adjusts to display only the area you selected.
The x range selected is used as the new x range. The y range
autoscales to show all graphed data points in the selected range.
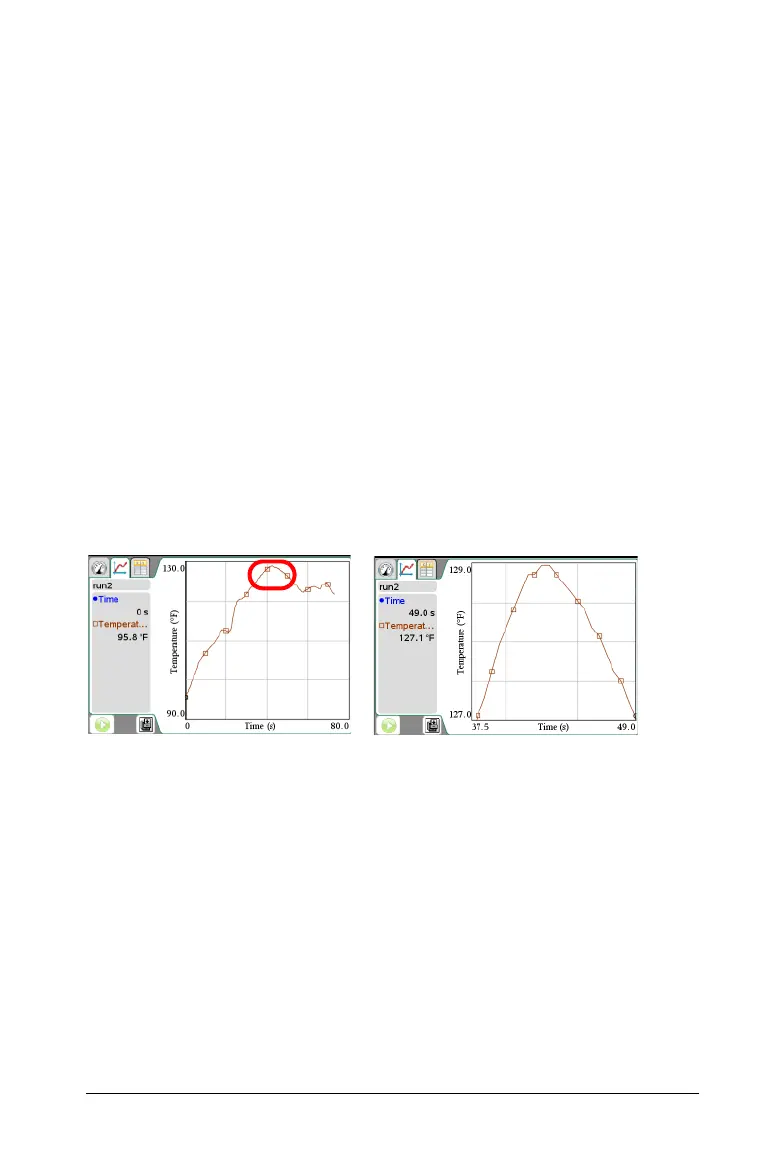
These images show an original view and zoom in performed multiple
times (or as a selected region).
Zooming Out of a Graph
To zoom out of a graph:
Select
Graph > Zoom Out.
The graph is now expanded.
If a zoom in preceded a zoom out, the graph displays the settings
prior to the zoom in.
For example, if you zoomed in twice, the first zoom out would display
the window to the first zoom in. To display the full graph with all
data points from multiple zoom ins, use Autoscale Now.

 Loading...


