58 Analyzing Data in Graph View
Plotting a Model
This option provides a manual method for plotting a function to fit data.
Use one of the predefined models or enter your own.
You can also set the spin increment to use in the View Details dialog box.
Spin increment is the value by which the coefficient changes when you
click the spin buttons in the View Details dialog box.
For example, if you set m1=1 as the spin increment, when you click the
up spin button the value changes to 1.1, 1.2, 1.3 and so on. If you click
the down spin button, the value changes to 0.9, 0.8, 0.7, and so on.
To plot the model:
1. Click
Analyze > Model.
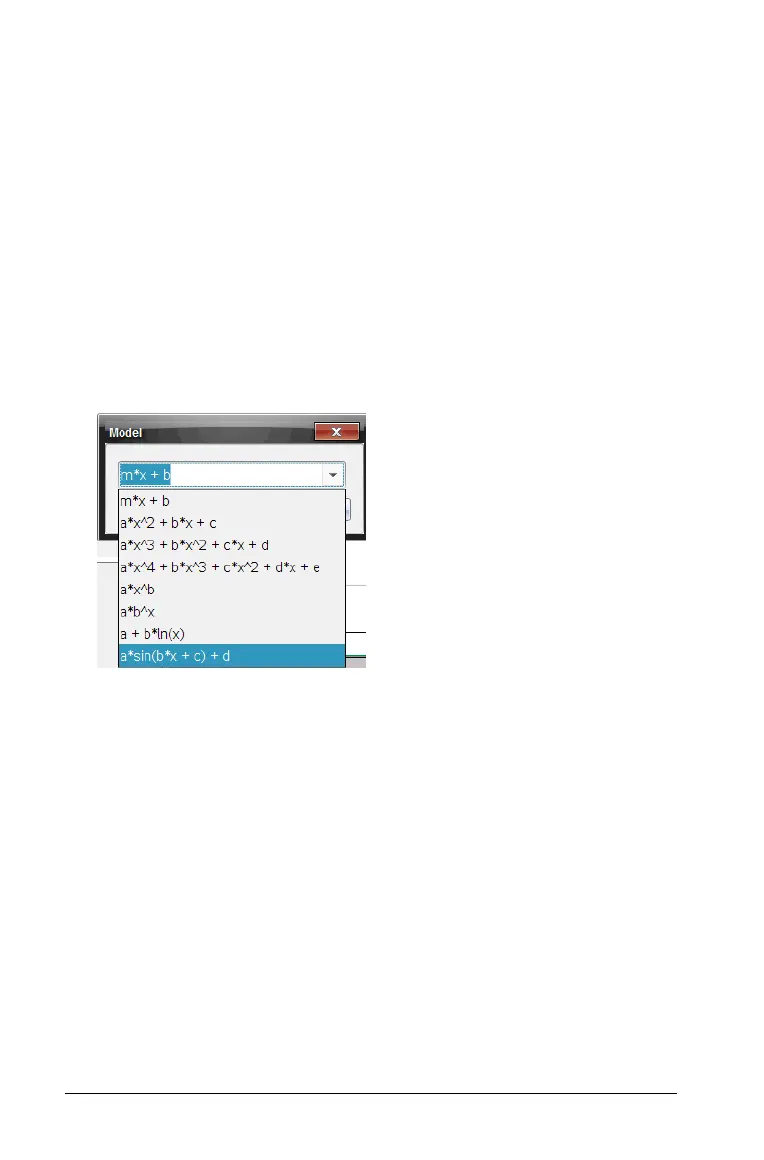
The Model dialog box opens.
2. Type your own function.
—or—
Click to select a value from the drop-down list.
3. Click
OK.
The Set Coefficient Values dialog box opens.

 Loading...


