EasyManuals Logo

Texas Instruments TI-Nspire Guide Book

Texas Instruments TI-Nspire
112 pages
To Next Page IconTo Next Page
To Previous Page IconTo Previous Page
Page #63 background imageLoading...
Page #63 background image
Analyzing Data in Graph View 59
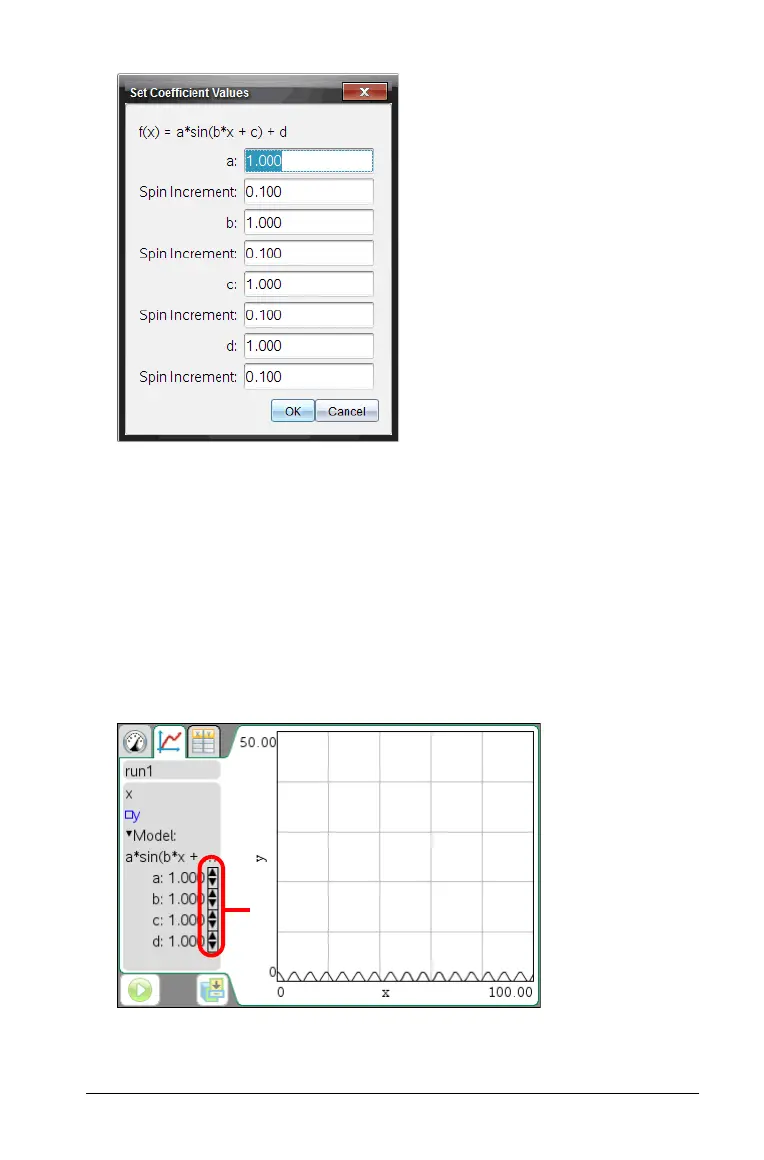
4. Type the value for the variables.
5. Type the change in value in the Spin Increment fields.
6. Click OK.
Note: These values are the initial values. You can also adjust these
values in the View Details area.
The model is shown on the graph with adjustment options in the
View Details area and in the All Details for Graph dialog box.
Notice that the minimum and maximum axis are too large for this
particular example.
7. (Optional) Adjust the window setting for minimum and maximum
axis values. For more information, see Setting the Axis for One
Graph.
Spin buttons

Table of Contents

Other manuals for Texas Instruments TI-Nspire

Questions and Answers:

Question and Answer IconNeed help?

Do you have a question about the Texas Instruments TI-Nspire and is the answer not in the manual?

Texas Instruments TI-Nspire Specifications

General IconGeneral
TypeDisplay
Form factorPocket
Product colorBlue, White
Display resolution320 x 240 pixels
Display size (HxV) (imperial)0 \
Compatible operating systemsWindows Vista/XP Mac OS X 10.4/10.5
Battery typeAAA
Number of batteries supported4
Weight and Dimensions IconWeight and Dimensions
Dimensions (WxDxH)100 x 198.3 x 28.7 mm

Related product manuals