TI-89 / TI-92 Plus / Voyage™ 200 PLT Statistics with List Editor App Getting Started 4
Stats/List Editor Screens
Understanding the Stats/List Editor Screens
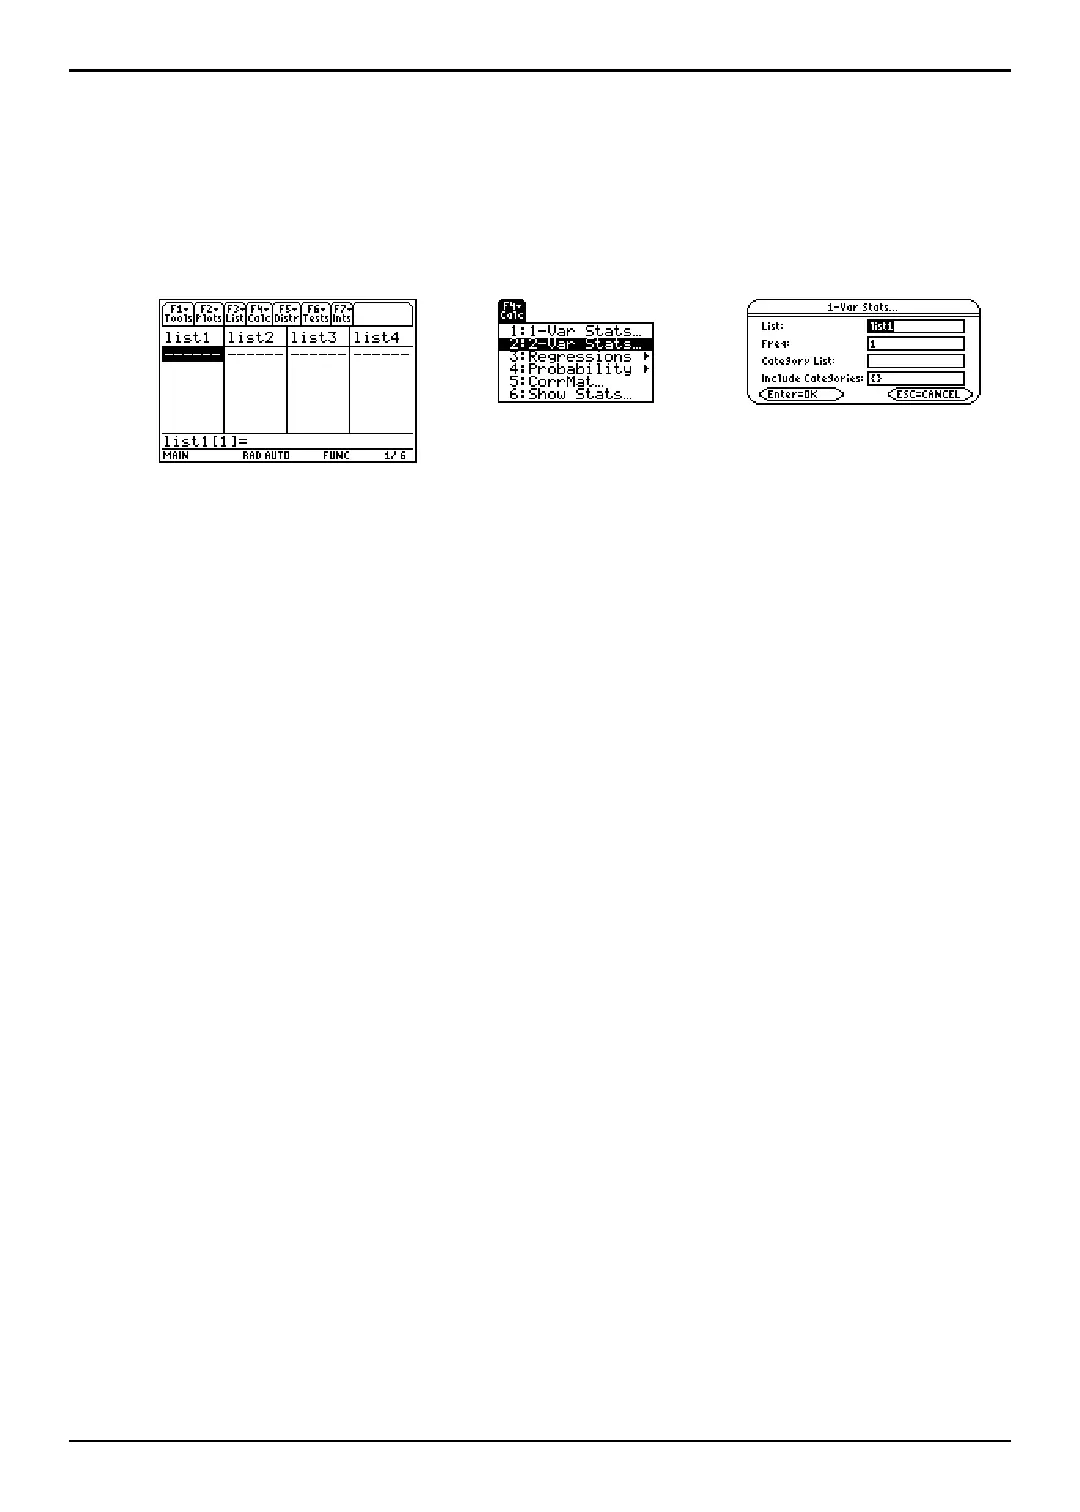
The three primary screens used in Stats/List Editor are shown below.
Note: All the screens used in this documentation were taken from the TI-89 calculator. The screens
displayed on the TI-92 Plus / Voyage™ 200 PLT are similar.
list editor menus dialog boxes
From the list editor
screen, you can:
¦ Store, display, and edit
statistical input data in
lists.
¦ Perform statistical
analyses and store
results in output lists.
From menus you can
access various statistical
operations. For example,
the
F4 Calc menu lets
you calculate:
¦ One- or two-variable
statistics.
¦ Several types of
regressions such as
exponential, linear, and
quadratic regressions.
In dialog boxes, you can
view:
¦ Prompts for data input.
¦ Data output of
statistical calculations.
¦ System messages.
You begin most of the procedures found in this guidebook at the list editor screen, where
you execute instructions, perform statistical analyses, and view the results.

 Loading...


